Resources for mapping and geographic information systems (GIS) in transport planning
National Grid square indexes
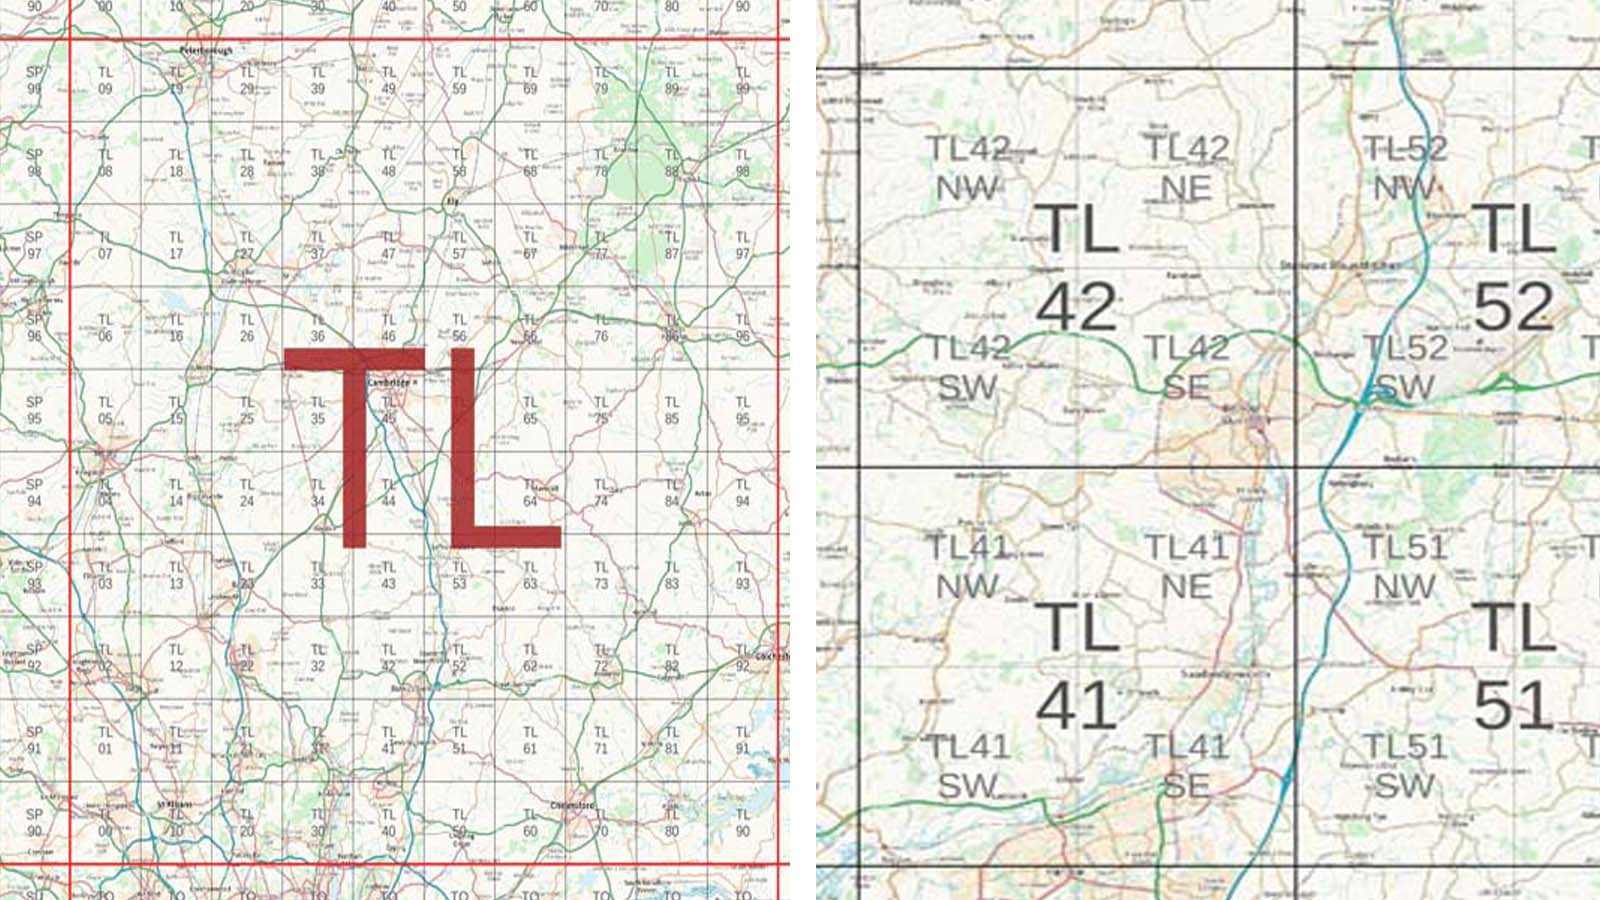
Some of the Ordnance Survey’s open data is made available as data tiles at various levels, but it can be awkward to guestimate which tiles are required for a particular project area – particularly when the file sizes are large. Having an index can help to more easily identify the tiles needed.
The zip file below contains just such a set of index files. It includes:
- 100x100km squares (shapefile – .shp and its sidecar files)
- 10x10km squares (ditto)
- 5x5km squares (ditto)
- Individual QGIS layer definition files for each of these three shapefiles
- A QIGS layer definition file for these three shapefiles grouped together
The index files are shapefiles and can be used in most of the common GIS software applications such as ArcGIS and QGIS.
Additionally, for QGIS users, the layer definition files provide ready-designed symbology and labelling. All you have to load the layer definition file: it will pick up the data and apply the symbology. Note that the files are set to be visible at appropriate zoom levels; if you can’t see the smaller squares, try zooming in.
Users of other software can apply symbology and labelling as they see fit.
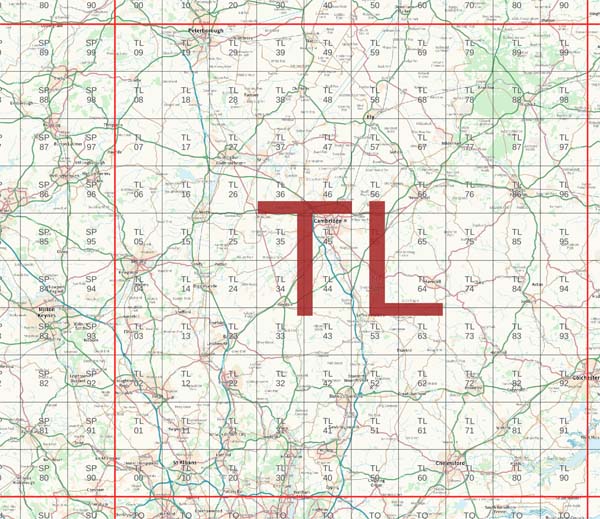
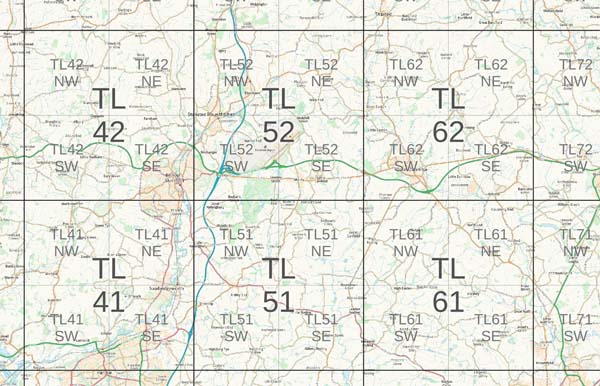
The index files, seen on top of base mappping from the OS Maps API (contains OS data (c) Crown copyright and database rights 2024).
Please see the terms of use before downloading.