Data and other resources on post-Covid travel demand, recovery and the ‘new normal’
DfT daily demand data
Since Covid the DfT has been publishing daily national-level travel demand statistics. These are now released each month. The accompanying methodology note is important for understanding what the data actually are, especially as the definitions and methods vary by mode.
My charts below are based on this data. As we’re now most interested in the current state and ongoing impact, I start in January 2022. The final Covid restrictions were lifted in the first half of that year (details here for England, Scotland and Wales).
Road traffic (motor vehicles)
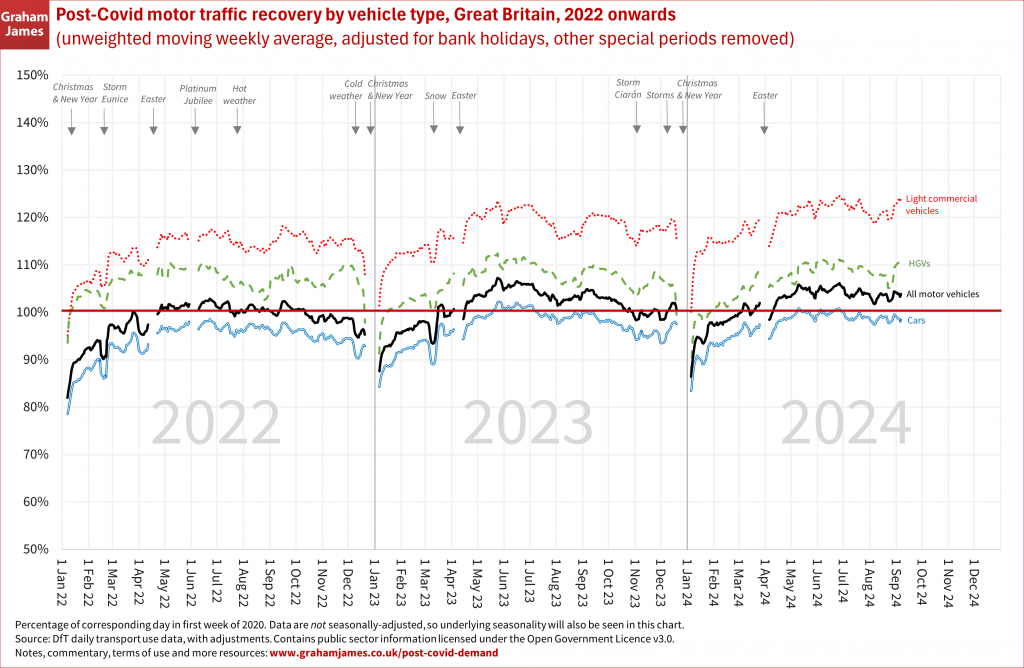
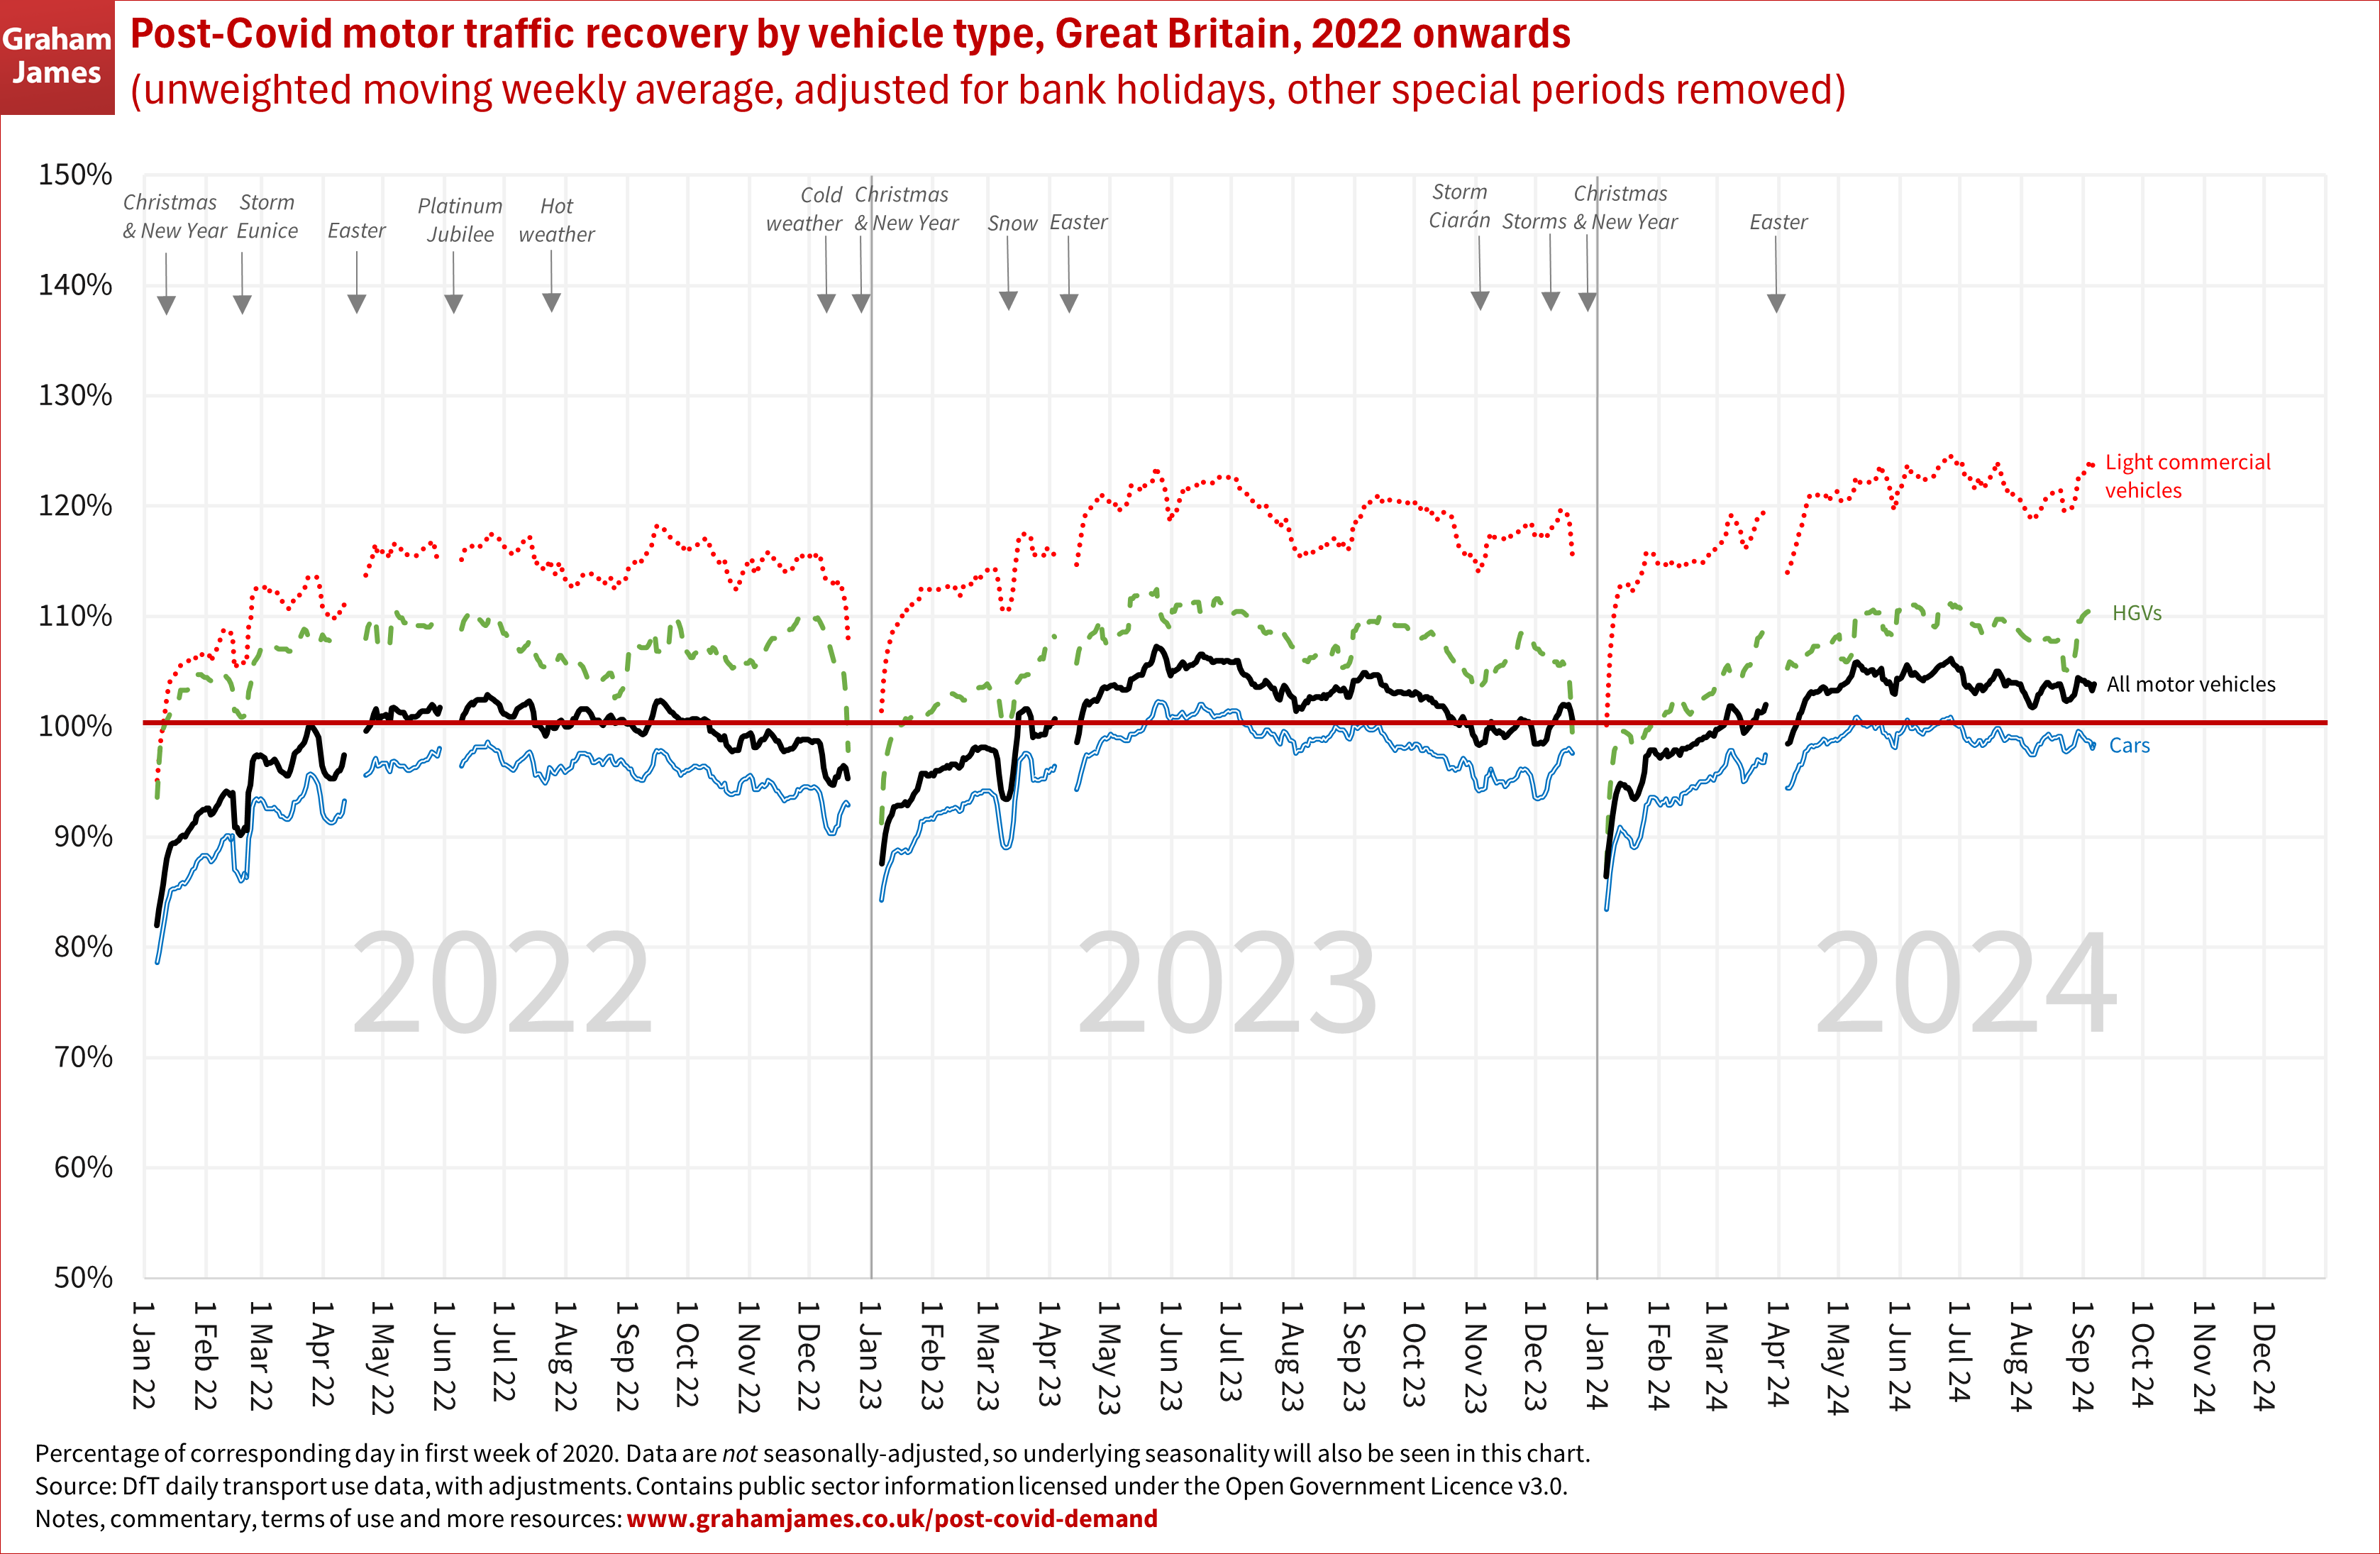
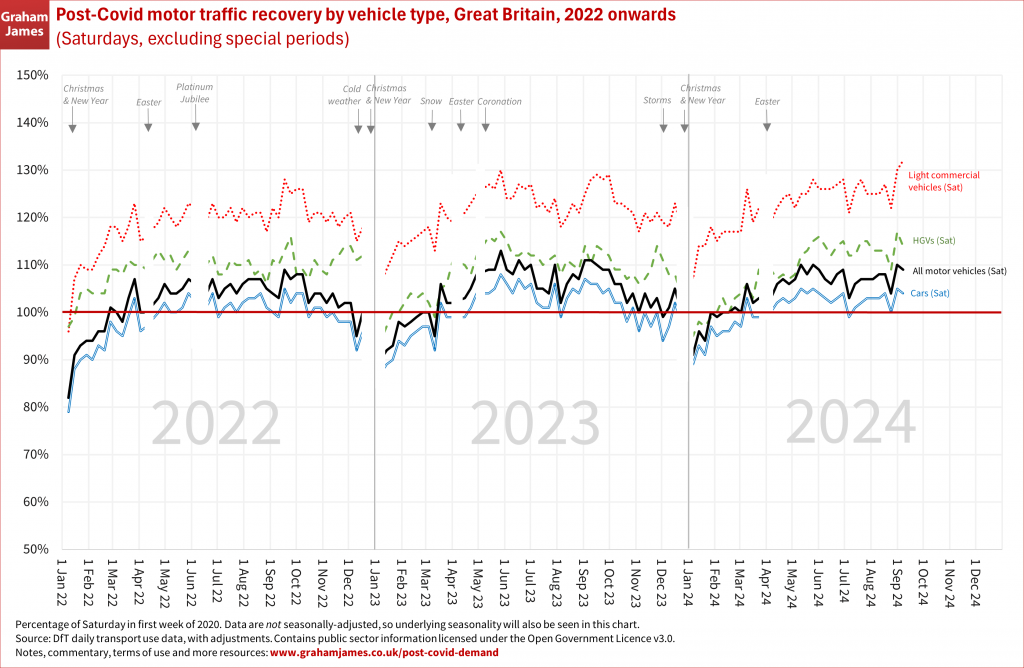
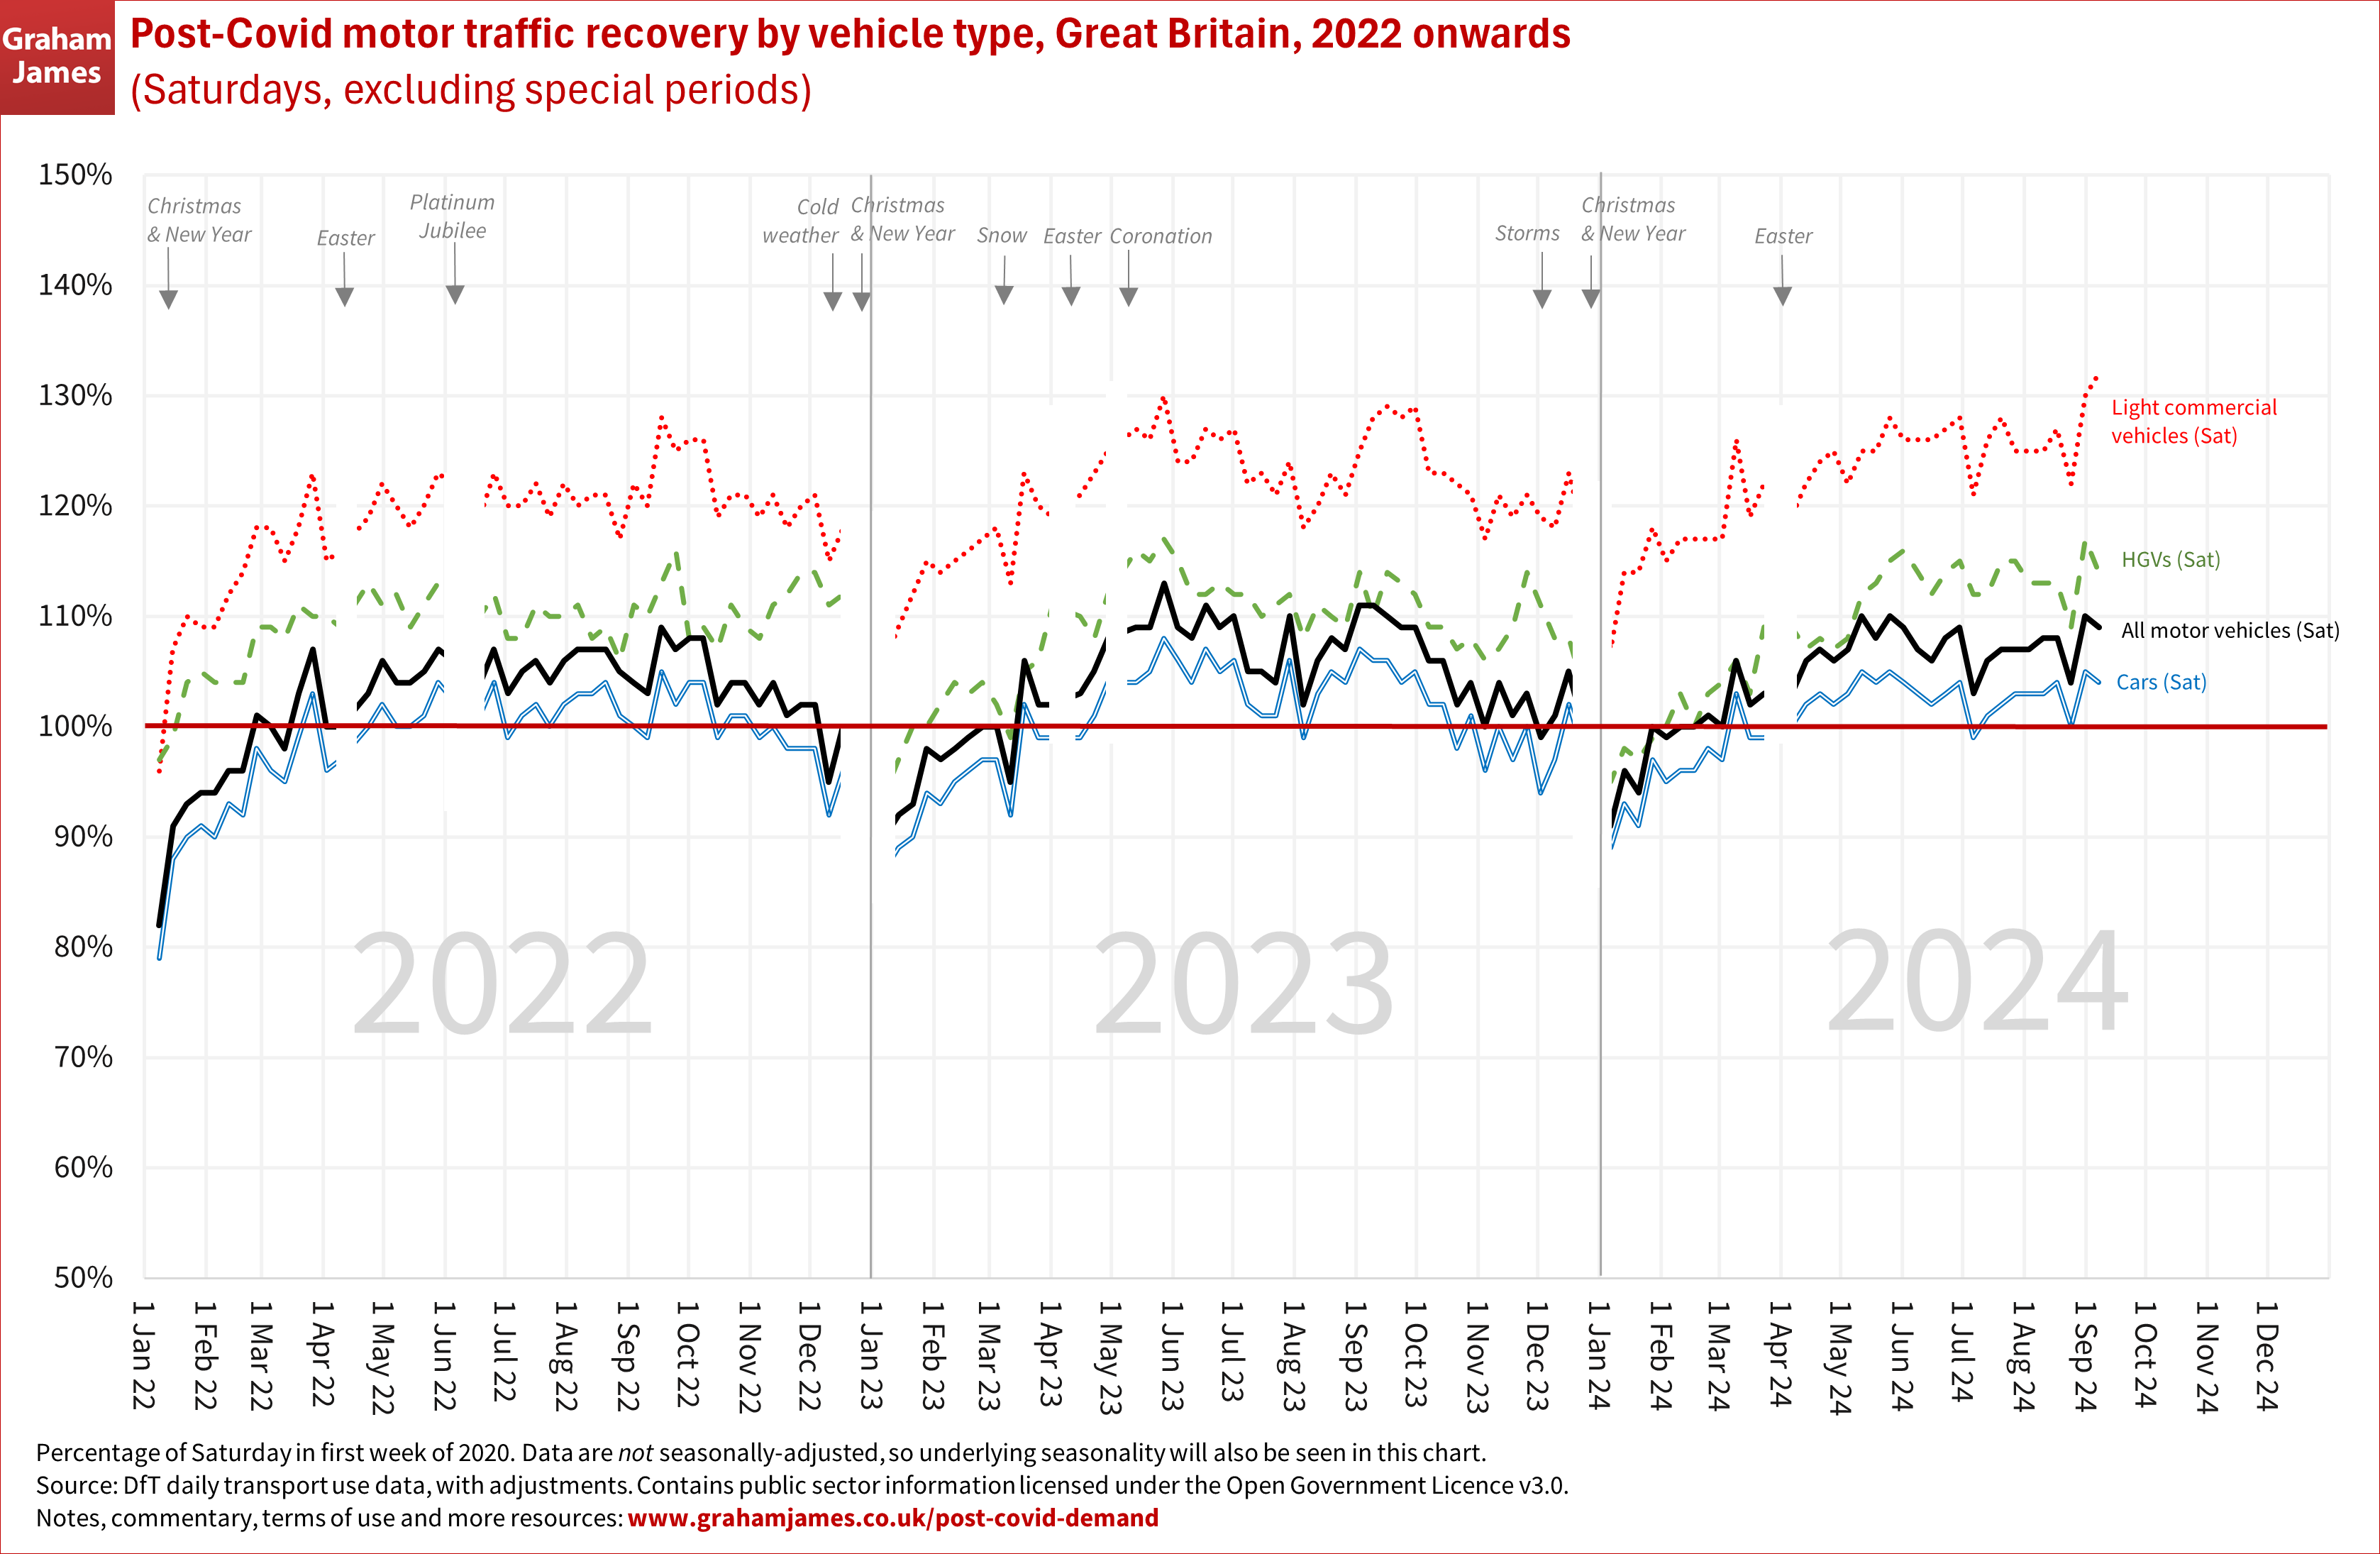
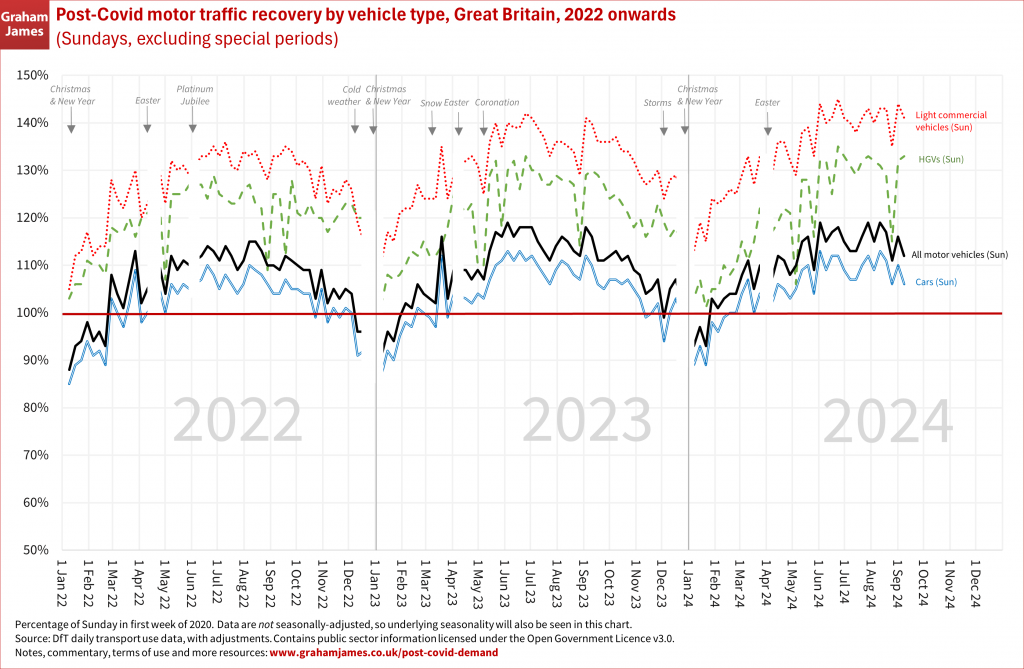
Updated with the September 2024 data release (data to early Sept 2024)
To help show underlying trends, I have adjusted for bank holidays and other special periods (details below). Remember that there is a general seasonal pattern to traffic levels.
Moving weekly average. Unweighted rolling average of a week’s traffic. Shows overall level of recovery (plus seasonal pattern)
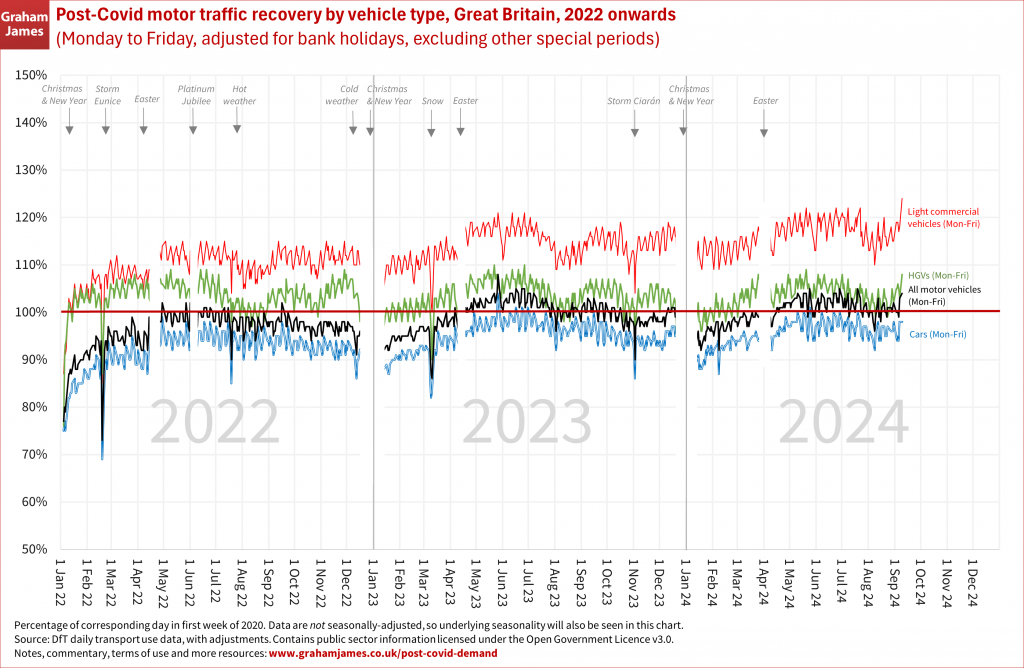
Monday-Friday traffic. Shows overall level of recovery (plus seasonal pattern) for weekday traffic. For ease of visualisation, each line continues across the weekends but does not include weekend data (in effect, the line interpolates from Friday to Monday). The original data have a characteristic pattern of higher volumes at the start of the week (HGVs and LCVs) or at the start and end of the week (cars and hence all motor vehicles) which comes through in this chart, but for looking at the big picture I would regard that as noise and just focus on the trends.
Saturday traffic. Shows overall level of recovery (plus seasonal pattern) on Saturdays. For ease of understanding, presented as a continuous line although of course the data points are the individual Saturdays.
Sunday traffic. Same approach as Saturdays.
Key points to note:
- Based on around 275 automatic count sites designed to be a representative sample
- Indexed to the corresponding day of the week in first week of Feb 2020, ie just before Covid. This is important as it means:
- The baseline or reference point is just a single week, not a long-term average, so don’t read too much into any single percentage value (especially Sat and Sun)
- Underlying seasonal patterns will appear in the data
- Ordinarily we would have expected a few percent of background growth since 2020
My adjustments to allow a focus on trends:
- Removed effects of bank holidays, by replacing their data with the corresponding day from the previous / next week. (However, the Sundays immediately before bank holidays, which show a dip in HGV traffic, have not been adjusted.)
- Omitted the Christmas, Easter and Platinum Jubilee holiday periods
- The DfT data highlights severe weather periods – I have left these unchanged but highlighted them in the charts
Public transport
To follow…