Monthly motor traffic profile
DfT has a network of permanent traffic counters across Great Britain, feeding into a range of traffic flow statistics. These include the annual demand profile for motor vehicles, presented for rolling five-year periods and split by road type and vehicle type. I’ve used this data to create these up-to-date* profile charts. (* pre-Covid – see below)
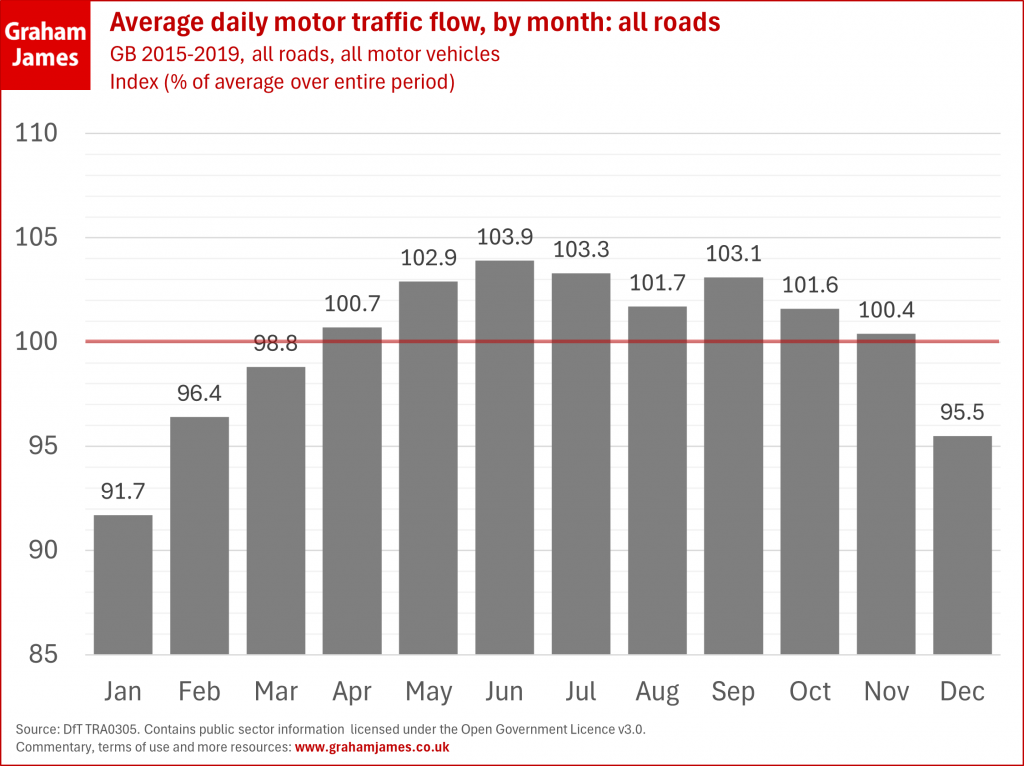
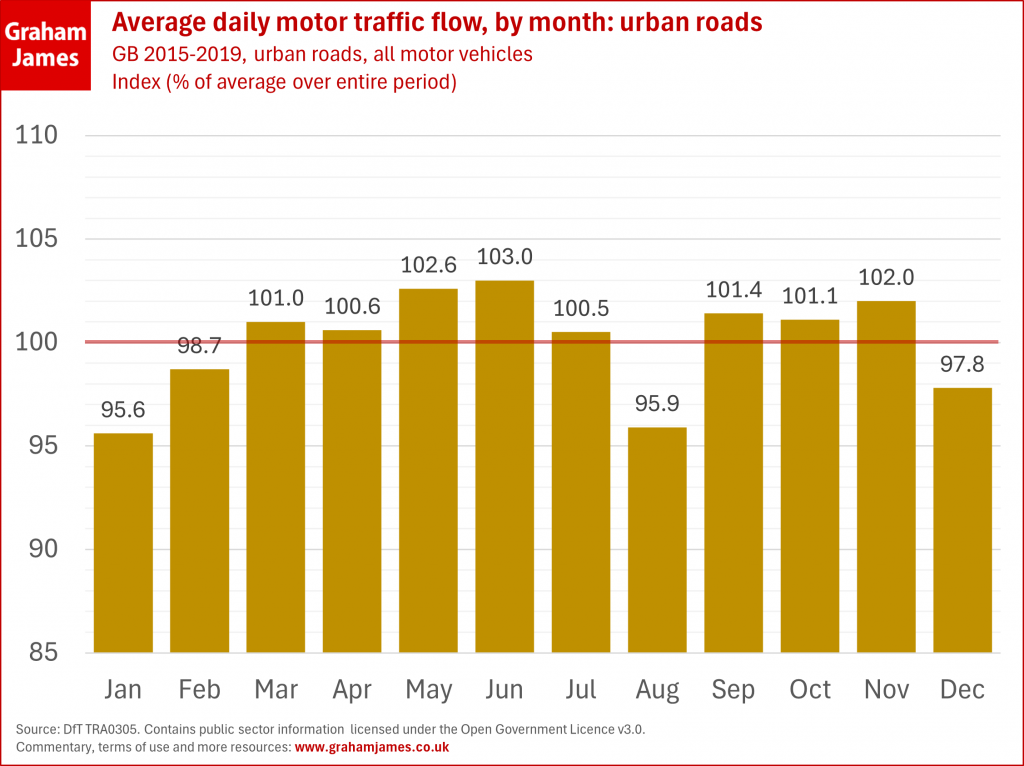
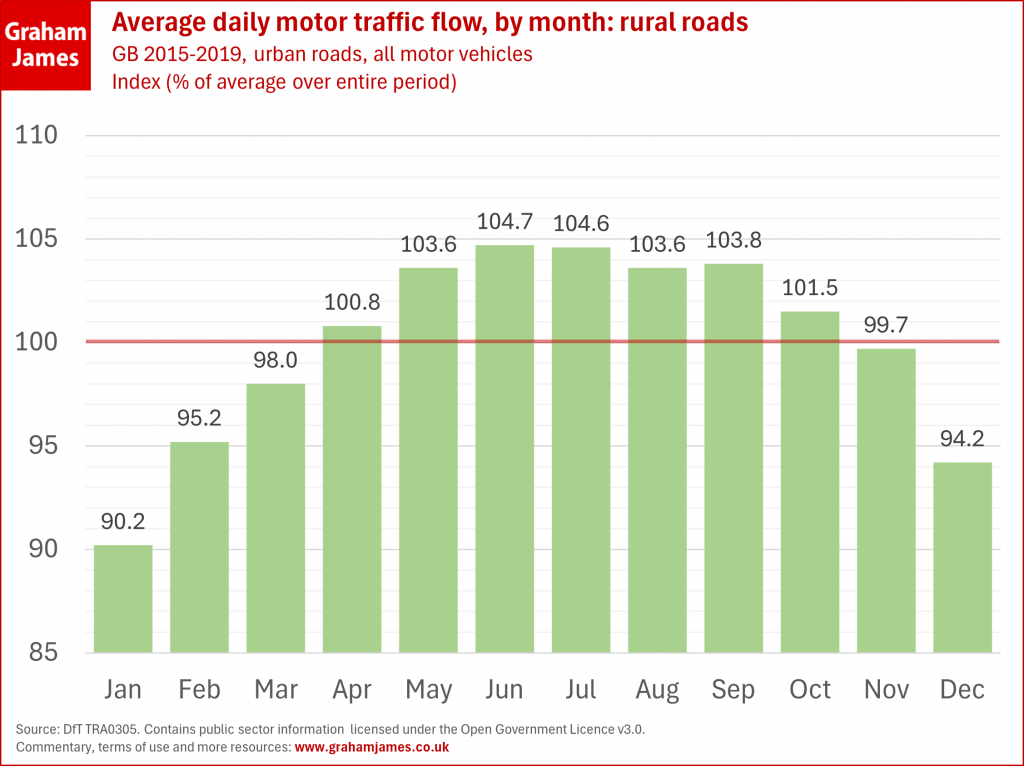
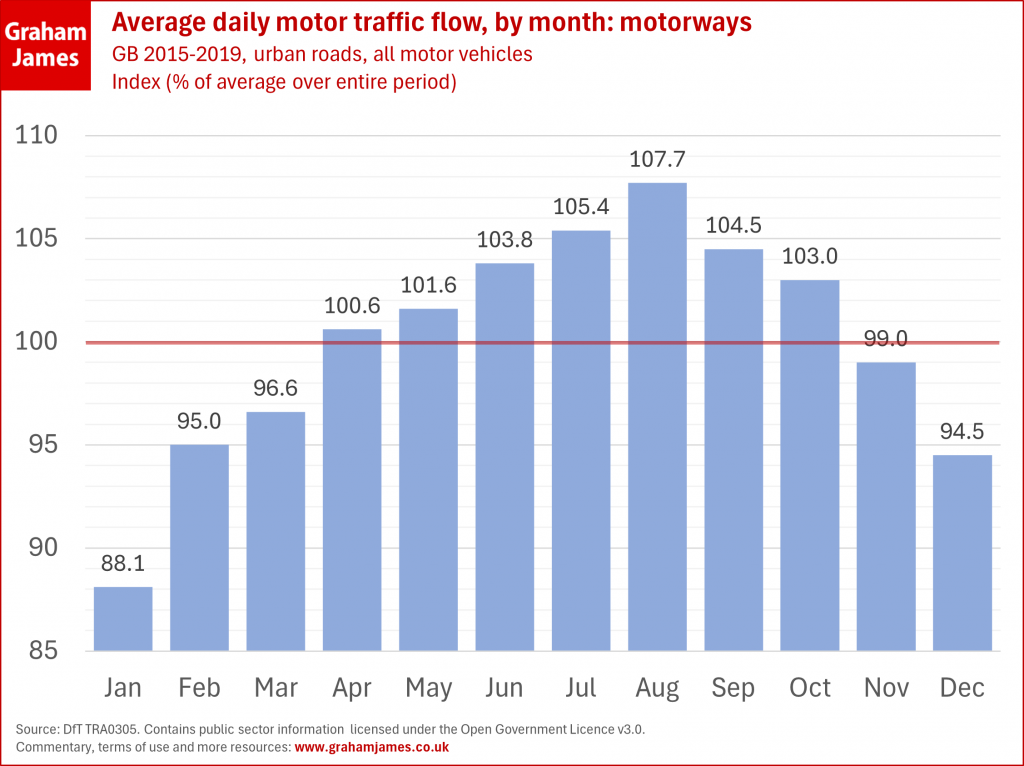
Firstly, charts showing the total traffic flow for all roads, urban roads, rural roads, and motorways. This is with the 2015-2019 data which is the most recent pre-Covid data. In all four cases, the winter dip is noticeable. For ‘all roads’ and rural roads, the profile is gently humped with most months being within 5% of the annual average. Motorway traffic is more strongly peaked, with its maximum in August. Urban roads show a complex profile with a clear dip August, similar in scale to the winter dip.
Download full-resolution version of these charts (.png, 150k each): all roads, urban roads, rural roads, motorways . Terms of use
The matrix below splits the data by vehicle type as well as by road type. The left-hand column (headed ‘all motor vehicles’) corresponds to the bar charts above. The remaining columns break the data down into cars, light or heavy goods vehicles, motorcycles, and buses/coaches. These charts also include the two preceding five-year rolling periods (2013-2017 and 2014-2018) for completeness, although the differences between the three are minor[1]. Motorcycle volumes have a particularly pronounced seasonality and so the vertical axis has been expanded for their charts.
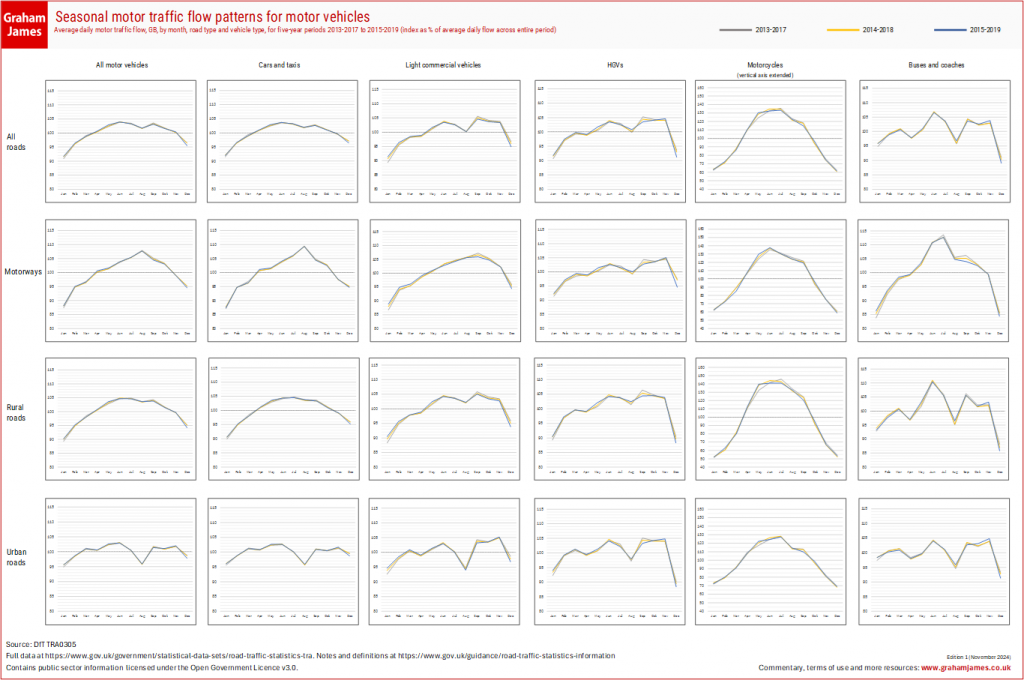
Download A4-size PDF (200k) or medium-resolution .png file (172k) of these charts. Terms of use
Coming soon… has Covid affected this seasonal profile?
[1] There was a change in methodology between the 2012-2016 period data and the 2013-2017 period data; for clarity, the charts only show the data with the new methodology.