 by
by Graham looks at some more issues involved in bringing embodied carbon into economc appraisal and decision-making
Previously in this series: Part 1: Bringing-in embodied carbon
The first part of this series looked at how England’s transport appraisal guidance now asks us to include the value of embodied (aka capital) carbon in appraisals, and how transport planners go about estimating the amount of embodied carbon in a particular project. In this second part, I’ll be looking at two more issues around how we tackle this.
Consistency and differences in approaches and assumptions
Economic appraisal is not a mechanistic, turn-the-handle process, with firm inputs always leading to firm and inevitable answers. If it were, software or robots would handle the whole thing. But instead it involves professional skill and decisions about methods or assumptions. And there are limitations in available data, or choice of (varying) available data, so judgments have to be made. This is particularly true at the moment for appraising embodied carbon.
Comparisons between schemes, or between different stages of a scheme, may therefore reflect different approaches as well as substantive differences.
I don’t see it as a particular problem. This issue often comes up in transport planning: there are parallels in (say) traffic modelling, or in selecting trip rates for a transport assessment. As with any of those, you have to be alive to the issue and to understand what the assumptions are.
If you are making decisions by comparing schemes, then of course you do need a consistent basis, or if not, to be aware that some differences might be about the approach and not necessarily the substance. It’s the same advice as for comparing benefit-cost ratios (BCRs) or any similar metric.
Recent practice or anticipated practice?
We can generally expect, in the current age of decarbonisation, that construction materials and activities will reduce their carbon intensity over time. At a project level, we can expect lower-carbon options increasingly to be selected. And suppliers will be trying to reduce the carbon footprints of individual materials.
As I mentioned in part 1, early-stage embodied carbon estimates are likely to be based on previous similar projects, or benchmarks that are built around those. These estimates will therefore represent practice at the time of those projects, and might be a few years behind the curve. Is it reasonable to assume that practice will have moved on and that even the ‘business as usual’ (baseline) design will be lower-carbon than the benchmark, at least for certain materials? Or is that a speculative rather than a robust assumption?
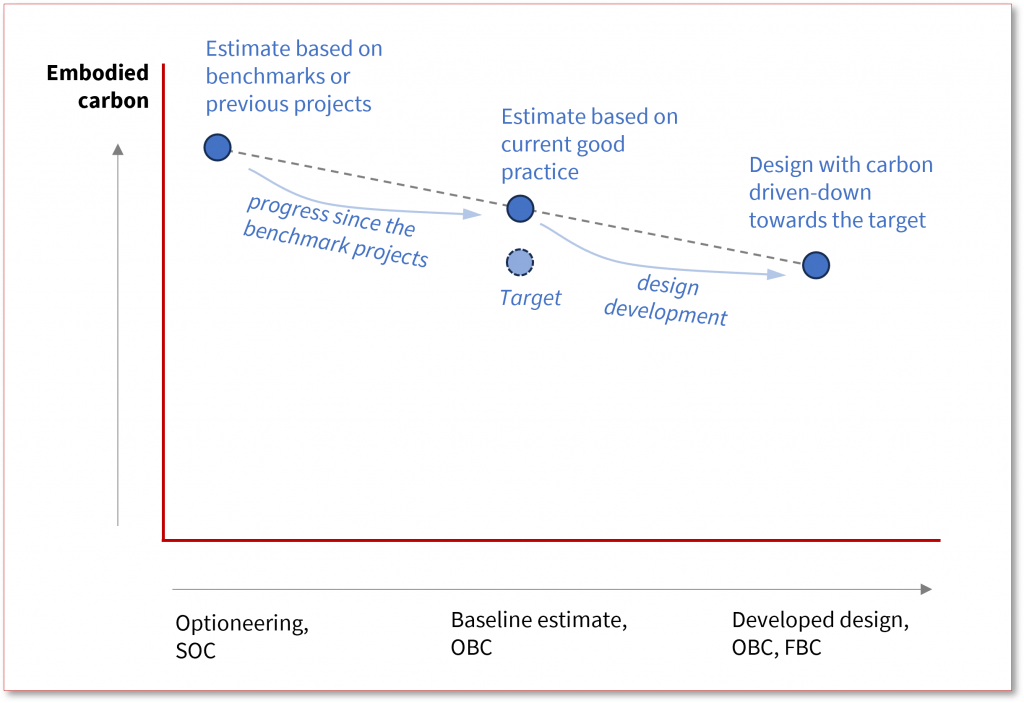
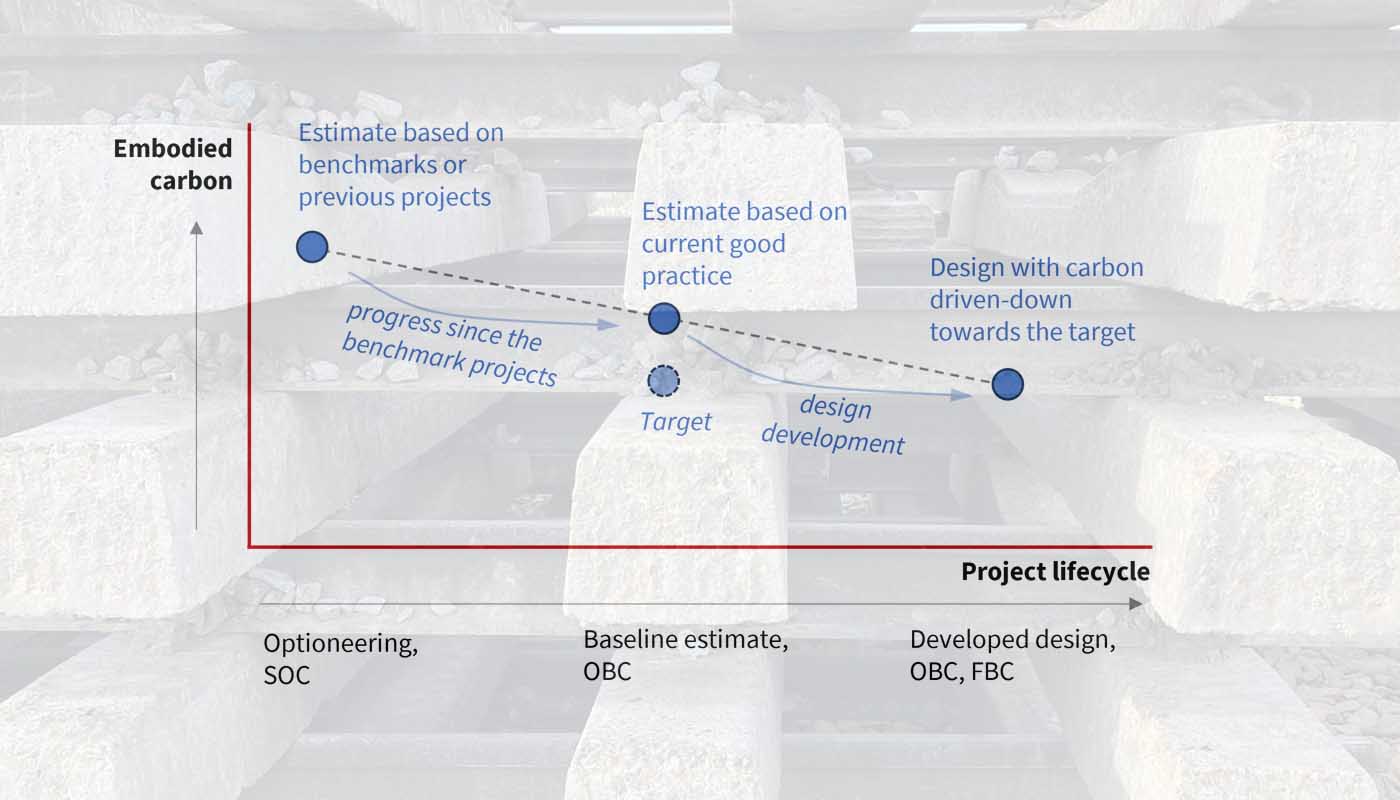
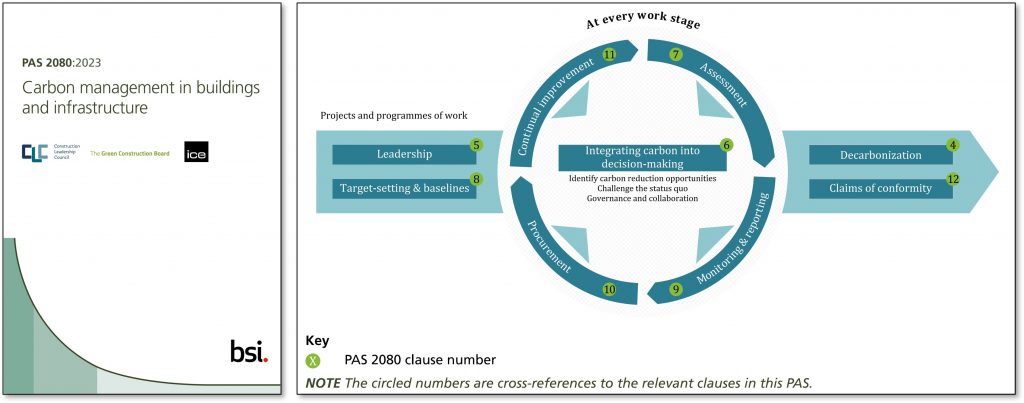
There’s a similar issue within the design stages of a project, as we could expect it to gradually reduce its carbon intensity as the design evolves. The British Standard carbon management process PAS 2080 sets the expectation of:
- a baseline expected level of carbon (business as usual with today’s good practice[1], which itself may be lower-carbon than historical benchmarks),
- a target level of reduction, and
- taking action to hit or better the target.
So at a certain stage in the project there will be a baseline carbon figure and an expectation of an even-lower figure in the final design. Should an appraisal be based on the design as it stands at the time? Is it right to anticipate an amount of carbon reduction (eg based on the target level) and bake it in to the appraisal, or would that be seen as merely an unevidenced hope – especially as the target is meant to be more onerous than latest industry good practice?
I would be pragmatic on this. The appraisal is there to support the decision-making, by providing a fair and sufficient picture, with the most focus on the things that most affect the decision. In the very early stages, it would often be proportionate to just explain that the figures are based on older projects with higher carbon than we’d expect today. Later, when there’s more detail and a baseline carbon estimate, it might be best to use the baseline estimate and set out the targeted level of reduction from it – particularly if the difference between BAU and target won’t actually affect the decision. Alternatively, if there is high confidence in hitting the target level (eg in an organisation for whom the target is genuinely a critical success factor), that might be the one to use. And in the (perhaps currently rare) cases where the embodied carbon figure determines ‘go’ or ‘no-go’, more attention obviously needs to be paid to the potential range and the level of uncertainty. More on that next time.
Finally, it’s worth mentioning that the carbon appraisal should be consistent with any environmental assessment. A lot of the later-stage carbon estimation work would sensibly be done once and would apply to both of these processes.
[1] PAS 2080:2003, paragraph 8.2.2d and the corresponding Note 1