For use with the DfT Connectivity Tool and its ‘connectivity matrix’
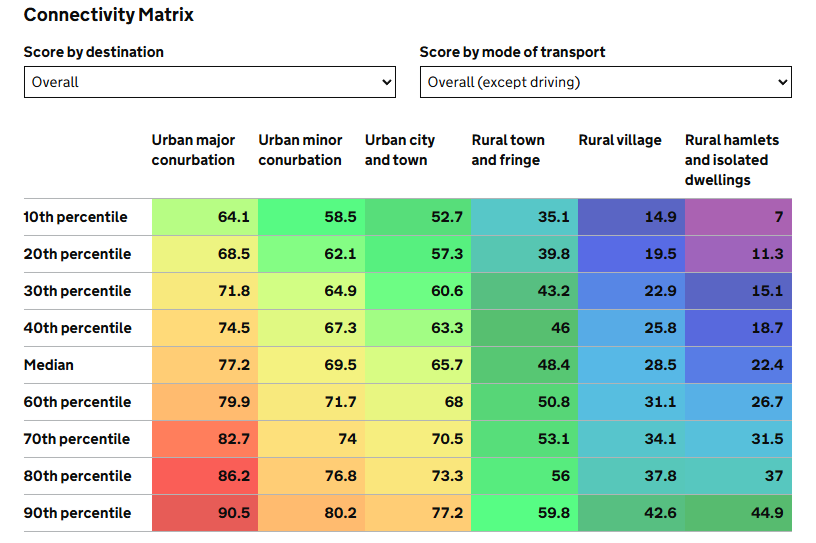
The DfT has created a ‘Connectivity Matrix’ for use with its Connectivity Tool.
The principle of the matrix is that because an area’s connectivity is heavily correlated with its level of urbanisation, it may be helpful to compare a grid square in the tool against the spread of scores for all squares of the same rural-urban class. To do so, you need to know which class the square you are interested in falls into.
To make this easier, I’ve created the map above. You can zoom in on any part of England or Wales and see what class it has been assigned to. The classifications are based on census output areas (OAs), not the individual grid squares in the tool.
Once you know the appropriate classification, you can look at the matrix to see where your square’s score sits, within the spread of scores for that classification. There are dropdowns to select a particular version of the score.
The rural-urban classification
The rural-urban classification data are from the Office for National Statistics (ONS). Their webpage gives more details of how the classifications were derived. OAs are the basic dataset, from which classifications for higher-level geographies are also produced.
The ONS dataset has more categories than are used in the DfT’s connectivity matrix. This is because the non-conurbation categories are each divided into two, according to whether the OA’s wider surrounding area is sparsely populated or not. The DfT has combined these pairs for their matrix. I have therefore done the same on this map.
The connectivity matrix uses the 2011 classification, not the 2021 version. DfT says this is because in the 2021 version nearly 75% of output areas fell into a single category, making it less useful for comparing connectivity across different types of places.
You may need to apply your own judgment in some cases, as the ONS classification might not correspond to the classification that you would (with local knowledge) instinctively consider an area to belong to. The user guide gives more details of the methodology used.