 by
by The latest updates to DfT’s Transport Appraisal Guidance have been announced – with changes large, small or (in one case) puzzling. Graham has the details.
[June 2026 update: The changes described here have now gone live. I have retained the orignal text of this post, but with updated links where required.]
The UK Department for Transport (DfT) has announced the latest batch of forthoming updates to its Transport Analysis Guidance (TAG). This time around, there is total of seven individual Forthcoming Change notices: six published last month (April 2026), plus the one on values of travel time for road freight that was already published back in December 2025.[1]
The changes are due to go live this month (May 2026), but at the time of writing, only one of the updated units (A1.3, reflecting the new road freight values of time described below) has been published as a forthcoming change. There is also a December 2025 forthcoming change version of the databook, with those new values of time but not the other updates set out in the latest notices.
As usual, I’ve updated TAG-at-a-Glance based on the information available so far.
New values of travel time for road freight
The most significant change is the update to values of travel time for road freight. This was the subject of a consultation last year and is now confirmed as going into TAG.
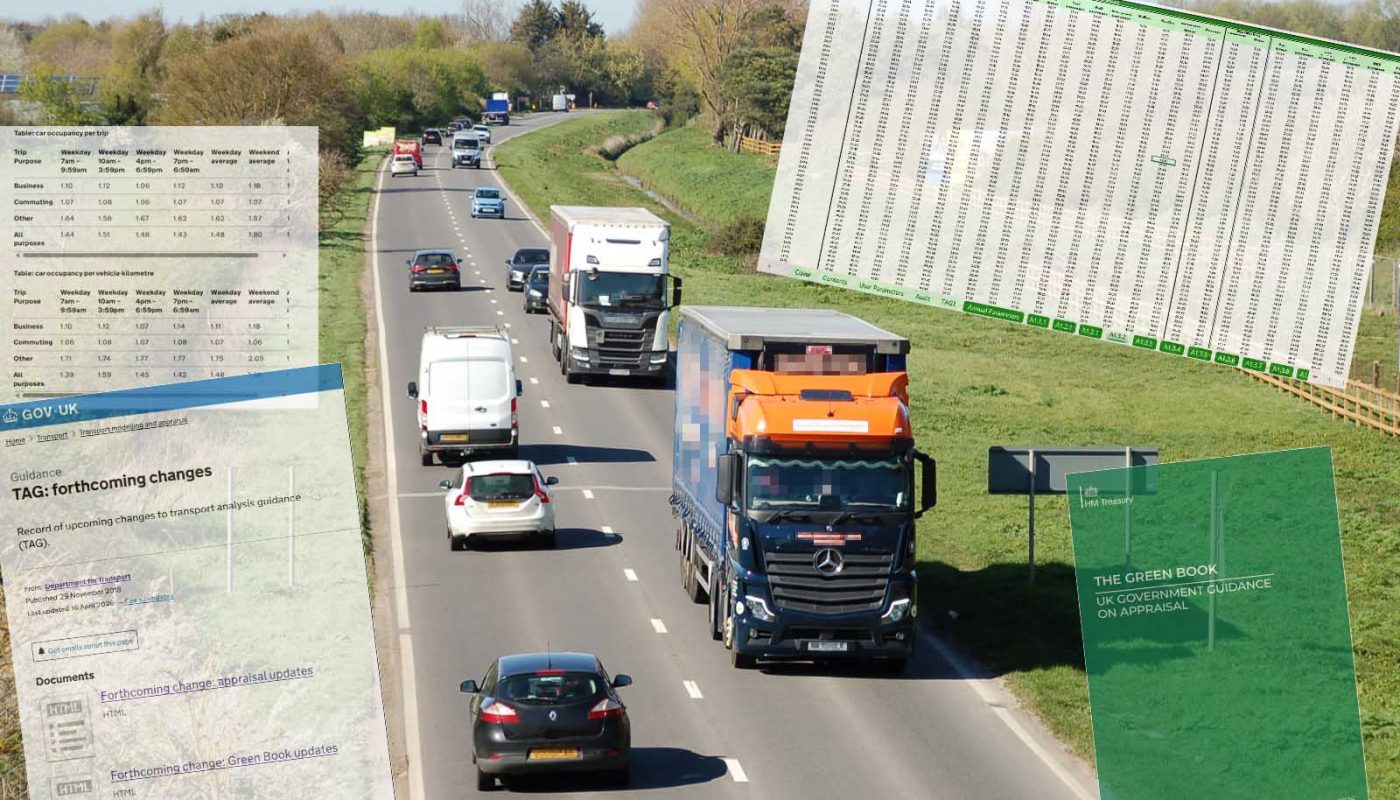
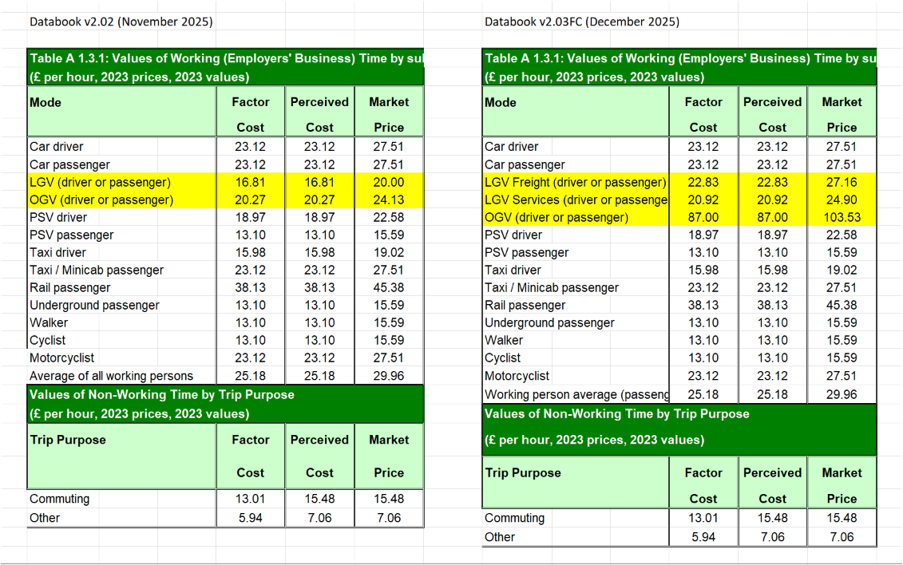
As I wrote at the time, the existing TAG values of time (VOT) for road freight were based primarily on the value of the driver’s wages and oncosts, but this approach doesn’t reflect potential overhead savings from shorter journeys, or the economic value of faster delivery of the goods themselves. The new valuations, based in part on research commissioned by DfT, go some way to addressing this. The values of time for heavy goods vehicles have more than tripled. The increase for light goods vehicle (LGV) trips carrying freight (which are about a quarter of all LGV trips) is less dramatic, but still considerable at 30%. DfT estimates that the average VOT across all traffic will increase by 15-40%, with motorways at the top of this range and minor rural roads at the bottom. (But see below for some separate changes to car and bus VOTs that will partly offset this.)
The December 2025 forthcoming change notice confirmed that these new road freight VOTs will flow into TAG, essentially as set out in the consultation document. The one substantive change since the consultation is that a sensitivity test of +/- 15% around the values of time for road freight is now recommended. According to DfT, this follows some feedback that asked for guidance on reflecting the uncertainty in the values. It’s also in line with the existing advice to run sensitivity tests on other values of time.
The updated values of time also flow into updated parameters for journey time reliability. There are also consequential changes to some of the technical parameters around journey purposes, non-fuel operating costs and the uprating of values for future years. I covered these in detail in my earlier piece.
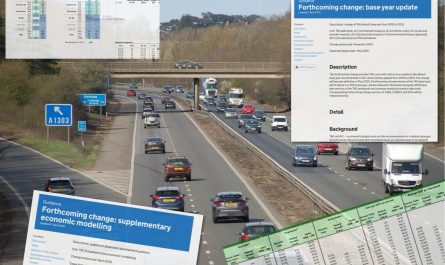
Finally, the increased values of time also flow into increased marginal external cost (MEC) values for reducing congestion (which are usually the lion’s share of MEC benefits). DfT has made a simplified ‘off-model’ update for May 2026. If you’re using the MECs split by type of location and road in databook table A5.4.2, DfT says these decongestion benefits have increased by 5-30%. If you’re using the alternative split by region and time-of-week in table A5.4.4, these values have increased by 8-21%. DfT had been hoping to release a ‘fully-modelled’ update at this point, based on a full run of the National Transport Model (NTM), but this has been delayed. When it comes out, it will include redistribution of traffic in the NTM and will therefore update the values for the other categories of MEC as well as the decongestion benefits.
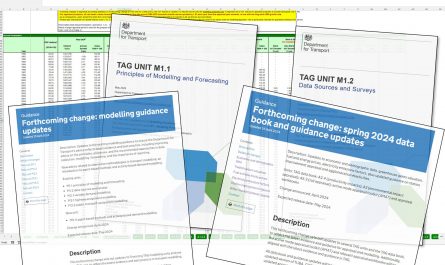
All in all, the changes affect units A1.3 (user and provider impacts), M3.1 (highway assignment modelling), the Databook, TUBA, the Transport Economic Efficiency table and the Appraisal Summary Table.
Keeping pace with the Green Book
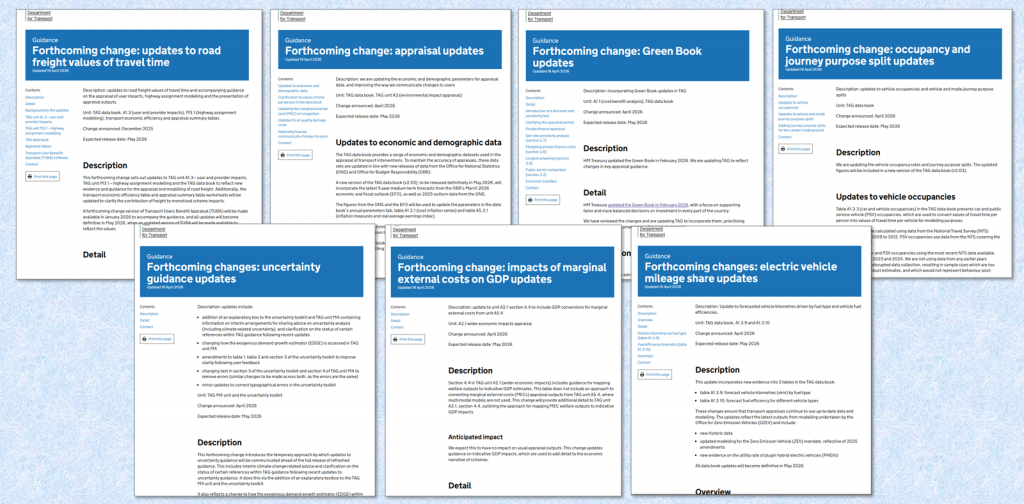
Several changes to unit A1.1 (cost-benefit analysis), wrapped up in a single notice, are made in response to the latest version of the Treasury’s Green Book. They are:
- A sensitivity test for the discount rate (see below).
- A clarified definition of the appraisal period, making it explicit that TAG practice differs from the Green Book.
- New guidance on appraising options involving private finance. This essentially brings existing Green Book guidance into TAG.
- New guidance on the treatment of economic transfers. These are payments where no good or service is received in return – such as grants, fines or developer contributions. Although the cost to the payer and the benefit to the recipient cancel each other out, they can have other effects, including an impact on benefit-cost ratios. The Green Book has revised and expanded its guidance in this area, which is now being translated into TAG. In practice we are used to dealing with some of these, particularly developer contributions. The Green Book now allows economic transfers to be either included in the sums or ignored, but TAG will say they should be included.
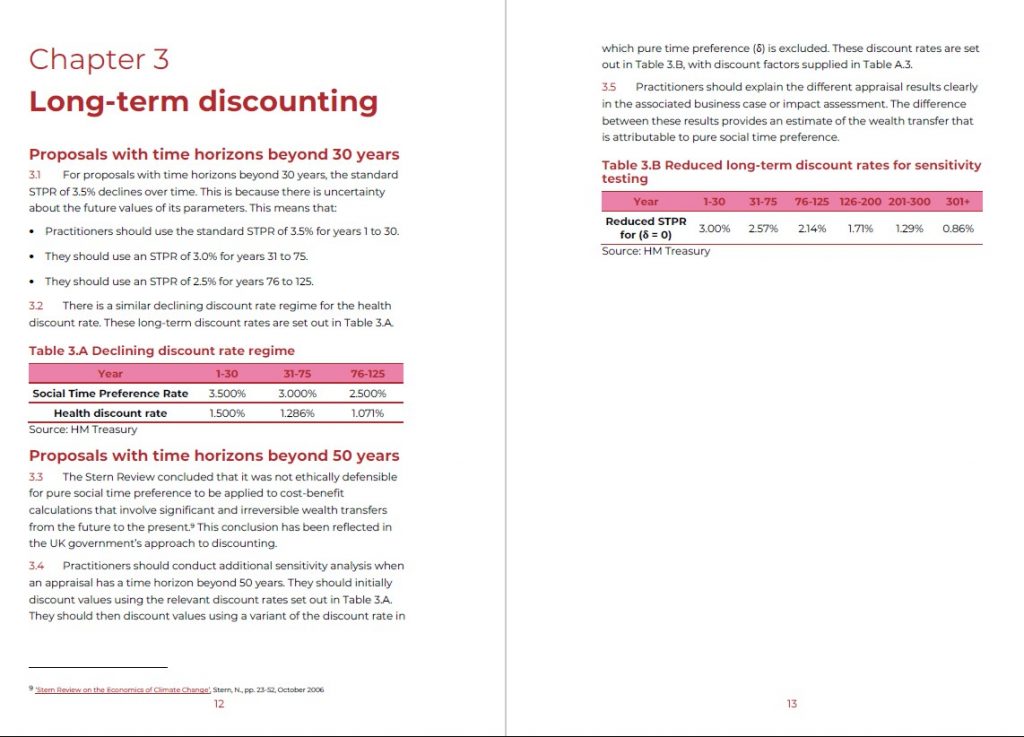
The sensitivity test on the discount rate is a curious change. I explained the issue in Local Transport Today (LTT) (issue 937, 29 April 2026) (£). It’s all about the element of the discount rate that reflects society’s preference for benefits now rather than later, and for putting off costs until later. In the jargon this is the ‘pure time preference’. It represents 0.5% within the 3.5% ‘headline’ discount rate.
The previous Green Book said that for appraisals involving long-term and practically-irreversible effects – wording essentially aimed at climate change impacts – a sensitivity test should be run using a reduced discount rate that excludes the pure time preference. The latest Green Book advice now says to run this test for any appraisal over more than 50 years. DfT has incorporated this into TAG, meaning that many transport infrastructure schemes will need to run the test. My sample calculations suggest that BCRs will increase by around 15% on this test. But my LTT piece sets out my doubts over whether this new approach is really appropriate.
Uncertainty over uncertainty
In my blogpost on last December’s TAG changes, I mentioned several layers of changes to the guidance on dealing with uncertainty.
The changes that went live in December included updates to some of the Common Analytical Scenarios (CAS), and a rolling-back from the existing requirement to use the CAS – in favour of more generic requirements on scenario analysis.
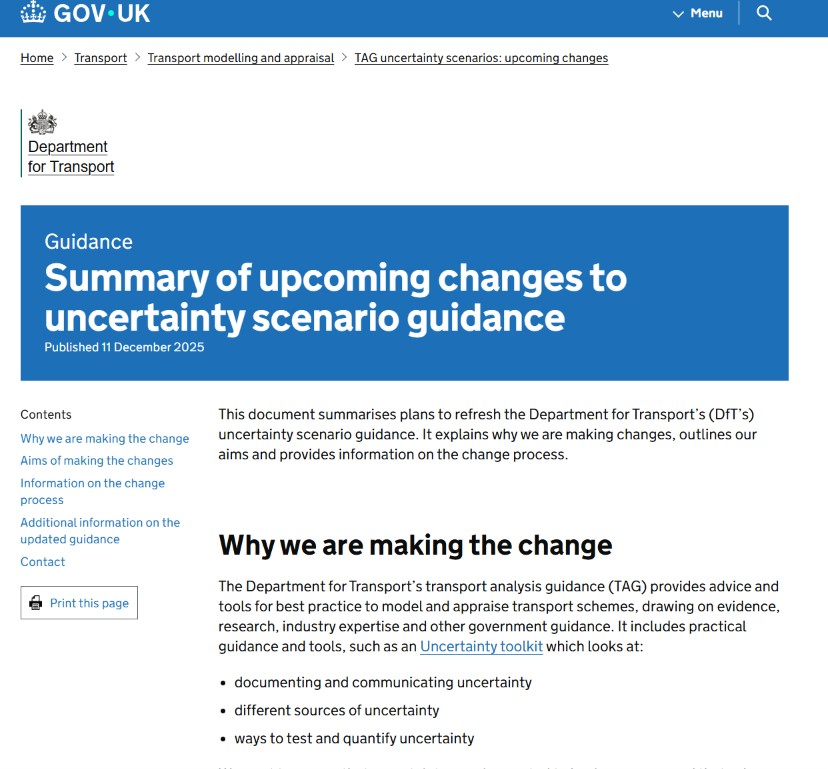
DfT had also separately flagged-up its intent to make further changes to the uncertainty guidance. There would be interim changes, within a years-long process of updating the guidance. One definite change was that the CAS would no longer be published in their current form; the December 2025 updates would be their last.
The current (April 2026) Forthcoming Change notice on this topic doesn’t offer many substantive clues to what the new direction will be. But we are told that ahead of the full release of updated uncertainty guidance in the formal units, interim updates will be published on the TAG website.
In the meantime, the notice gives some specific changes:
- There will be interim advice on climate change resilience, reflecting the section of the Green Book that deals with this (and presumably fleshing-out the recently-added reference to climate change impacts in The Transport Appraisal Process).
- The arrangements for the exogenous demand growth estimator (EDGE), DfT’s rail background demand forecasting tool, will change. EDGE itself will no longer be made available, but DfT will instead provide EDGE outputs on request.
- Corrected wording around the ‘envelope‘ approach to selecting a range of traffic growth scenarios (para 3.20.2 of the Uncertainty Toolkit and 4.2.3 of unit M4).
- Other changes to the Uncertainty Toolkit, for clarity.
Odds and ends
Finally, the remaining four notices cover a range of routine or minor updates.
- The databook’s economic and demographic data will be updated with the latest outturn data (what actually happened) from the Office for National Statistics, and the latest medium-term (five-year) forecasts from the Office for Budget Responsibility. As usual, these flow through into the various appraisal workbooks and the Active Mode Appraisal Toolkit (AMAT). DfT says to expect little impact from this update.
- Air quality valuations (databook tab A3.2) will be updated in line with changes to the source data from Defra, which includes both updated inputs and changed methodology. The central values per tonne for NOx and PM2.5 damage have increased by 9% and 34% respectively. There are also updated values for the alternative concentration-based costs in table A3.2.2; unit A3.1 will advise users to contact Defra for further guidance on this table.
- Updated annual figures for vehicle-km splits by fuel type (databook table A1.3.9) and fuel efficiency (A1.3.10). DfT has highlighted a reduction in the forecast short-term electric vehicle kilometre share, reflecting changes to the zero emissions vehicle mandate and new data on how hybrid vehicles are actually used. But it says the long-term trend is not significantly altered.
- Updates to vehicle occupancies (databook table A1.3.3) and journey purpose splits by vehicle or mode (table A1.3.4). The latter show some significant changes to the splits for buses and coaches (PSVs in the jargon) and heavy rail. The net effect, says DfT, is that the overall average value of time per car will fall by £1.17 per hour (7%), and the equivalent figure per PSV will fall by £6.03 (9%). To add to the fun, there are all-new journey purpose splits for London Underground.
- Databook table A1.3.1 (values of time per person) will gain a note to clarify that these values are uplifted by 1.5% per year for appraisal purposes. (Remember that annual VOT uplifts for appraisal and modelling now differ, with appraisal values growing at a steady 1.5% per year but modelling values growing more erratically in line with the GDP growth forecast for each year.)
- So that wider economic impacts practitioners don’t feel left out from the latest updates, unit A2.1 has new guidance on translating MEC impacts into their GDP equivalents. This fills a gap in the current advice on how to turn the welfare-based impacts that we normally deal with into GDP-based impacts.
And on a procedural note, DfT says it is looking to make it easier for users to understand what has changed in TAG after each cycle of updates. The plans include publishing an overview spreadsheet with links to previous versions of TAG units, and making sure the ‘provenance’ section of each unit is kept up to date.
And that’s what’s new for TAG in May 2026.
[1] It is now stated as being updated on 16 April 2026, but there appears to be no substantive change since the December 2025 version.
Contains public sector information licensed under the Open Government Licence v3.0.