 by
by Is it all about giving more weight to economic growth? Graham digs into the new Indicative BCR and other changes.
The UK Department for Transport (DfT) has published an updated version of its Value for Money Framework. In this blogpost I’ll be taking a look at what it’s about, some highlights of what’s new, and what difference it might make in practice – especially the new ‘Indicative BCR’.
What it is and why it matters
The framework is how DfT assesses value-for-money (VfM) and how it reports VfM issues to decision-makers. It’s not just about the benefit-cost ratio (BCR), but the full range of impacts and how robust the analysis actually is.
It’s complementary to the detailed transport analysis guidance (TAG). There is a degree of crossover, but the basic distinction is clear. TAG tells people doing appraisals how to crunch the numbers, how to express the impacts in monetary equivalents (‘monetising’), and how to crunch the words when you don’t have numbers (‘non-monetised impacts’). The VfM framework tells policy officials and decision-makers how to turn those TAG appraisal outputs into a bottom-line view of whether the proposed policy or scheme is actually good value or not. When we talk about a scheme being “high” or “low” value for money, this comes from applying the VfM framework to the appraisal results.
The framework is, in theory, mainly intended for DfT’s internal officials and decision-makers, and hence to apply to DfT’s own policies and investments. In practice it’s also widely used by local authorities and other stakeholders who generally adopt the key points even if not the full detail. Indeed the previous version advised local government to follow it – more on that later.
Finding your way around the VfM framework
There are actually three documents:
- The VfM Framework itself – previously published in 2017
- Supplementary guidance on VfM categories – previously published in 2016
- Supplementary guidance on landscape – last updated in 2021 – which is specifically about monetising landscape impacts
All three have been updated, but the first two are the ones to look at for most purposes. The substantive change is really in the framework itself. The categories document has been updated in line with this, and helpfully amplifies some of the new framework guidance. The two really belong together.
The landscape one is only relevant if you’re putting a £ value on landscape impacts, which isn’t the case for most schemes. It’s been updated to align with the changes in the other two, but the method itself hasn’t changed.
The new Indicative BCR
The headline change is the introduction of a new version of the BCR: the ‘Indicative BCR’. There’s also a corresponding ‘indicative net present value (NPV)’, the two together being the ‘indicative VfM metrics’, but for simplicity I’ll just refer to the BCR. And to keep this section manageable, I’ll just cover the basic principles rather than special cases.
First, a recap of the existing system. (If this is familiar stuff, you can skip straight to the change.)
The old
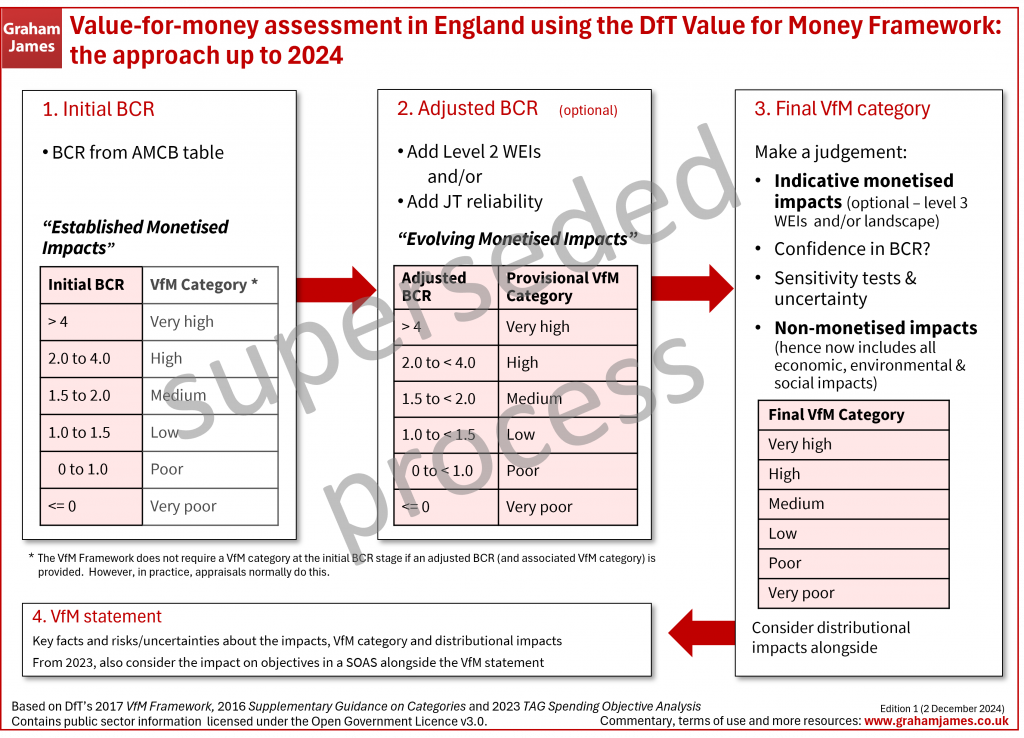
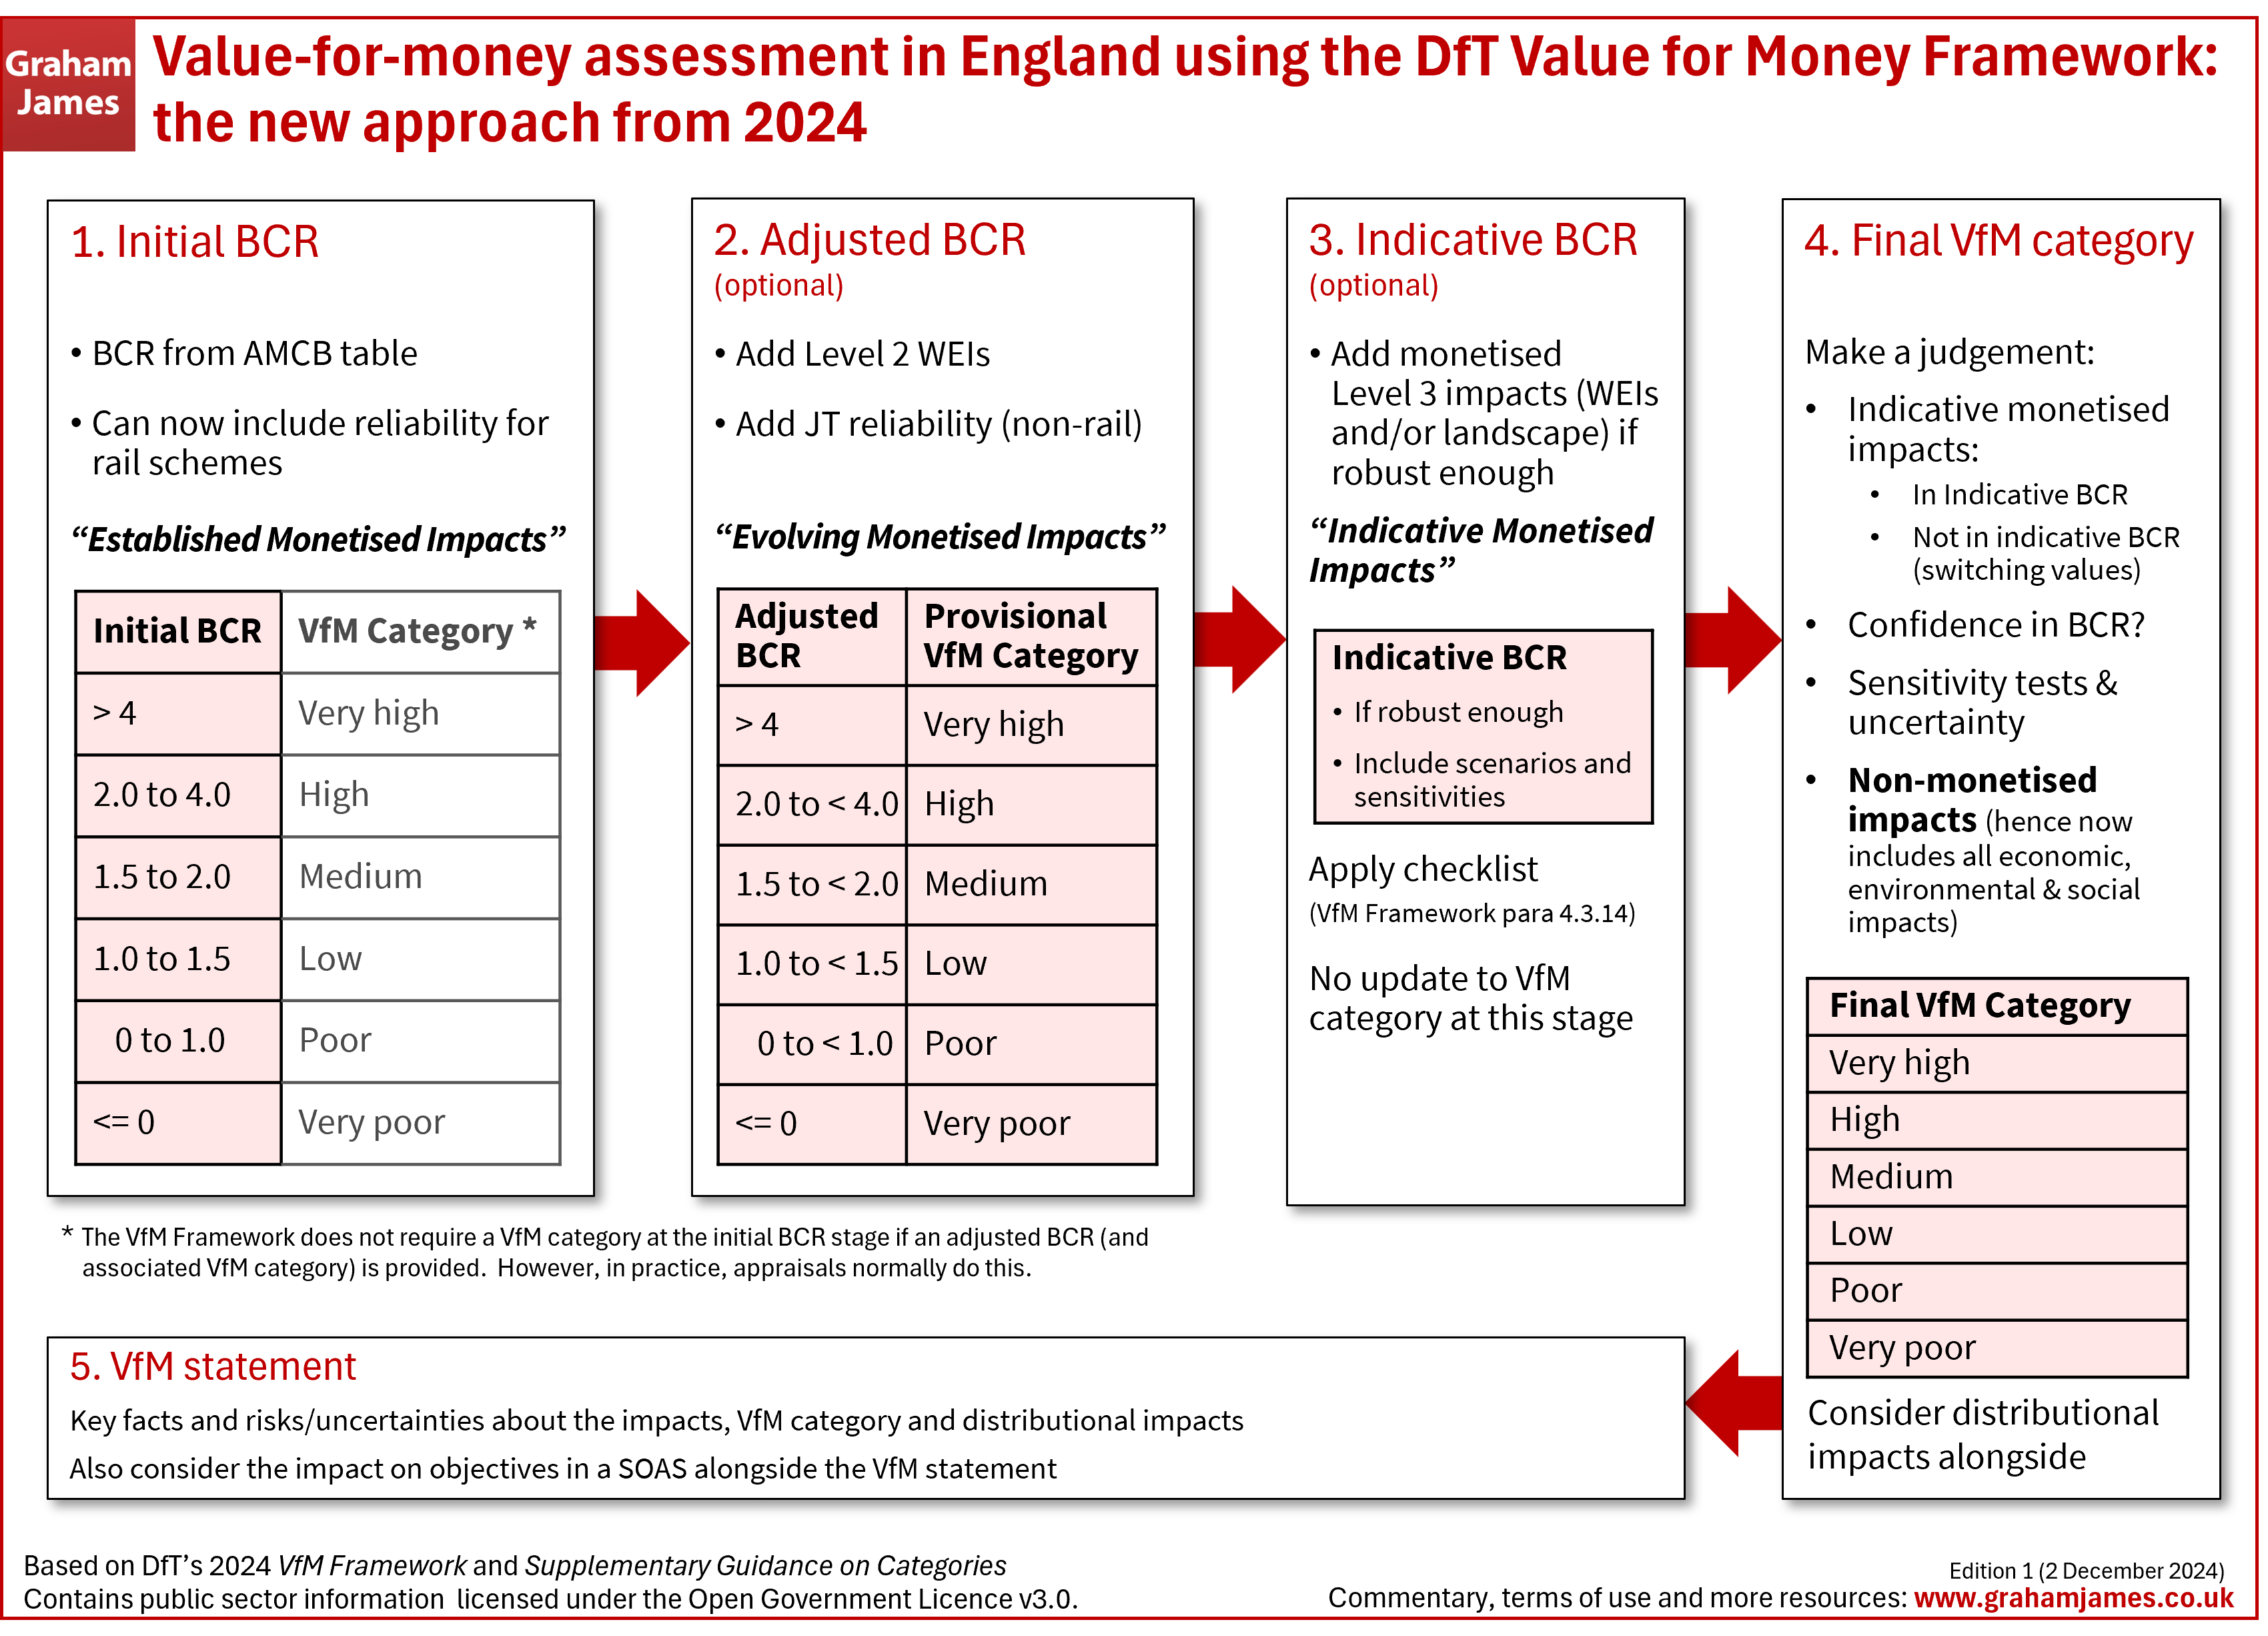
It starts with the basic monetised benefits such as journey time savings or greenhouse gas emissions. DfT calls these ‘established monetised impacts’. Divide these by the cost and you get a BCR, called the Initial BCR.
Some schemes also put a monetised value on journey time reliability (JTR), or on certain wider economic impacts (WEIs) based around improved connectivity (known as ‘Level 2 WEIs’). DfT calls these ‘evolving monetised impacts’: less well-established and less robust, so they can’t count towards the initial BCR. But you can add them to the mix at this second stage, creating an Adjusted BCR which includes them. If your scheme doesn’t involve these impacts or isn’t monetising them, then you stick with the Initial BCR.
Now you report the VfM category that your BCR falls into, based on the adjusted BCR if you have one or the initial BCR if you don’t. There’s a lookup table in the framework. For example, a BCR of 1.7 is ‘Medium VfM’. This is technically known as the Provisional VfM Category, although the phrase seems rarely used outside DfT. Where there are both initial and adjusted BCRs, practitioners tend to give the categories for both, although strictly it’s only needed for the latter[1]. So we get phrases such as “the Initial BCR is 1.7 which is Medium VfM, but adding WEIs gives an Adjusted BCR of 2.1 which is High VfM”.
So far, so simple. The next step is to determine the Final VfM Category. This brings in a number of factors which might justify a change from the provisional category, and involves judgment. These include non-monetised impacts, sensitivity tests, uncertainities, your confidence (or otherwise) in the BCR, and – the critical bit for this update – Indicative Monetised Impacts (IMIs).
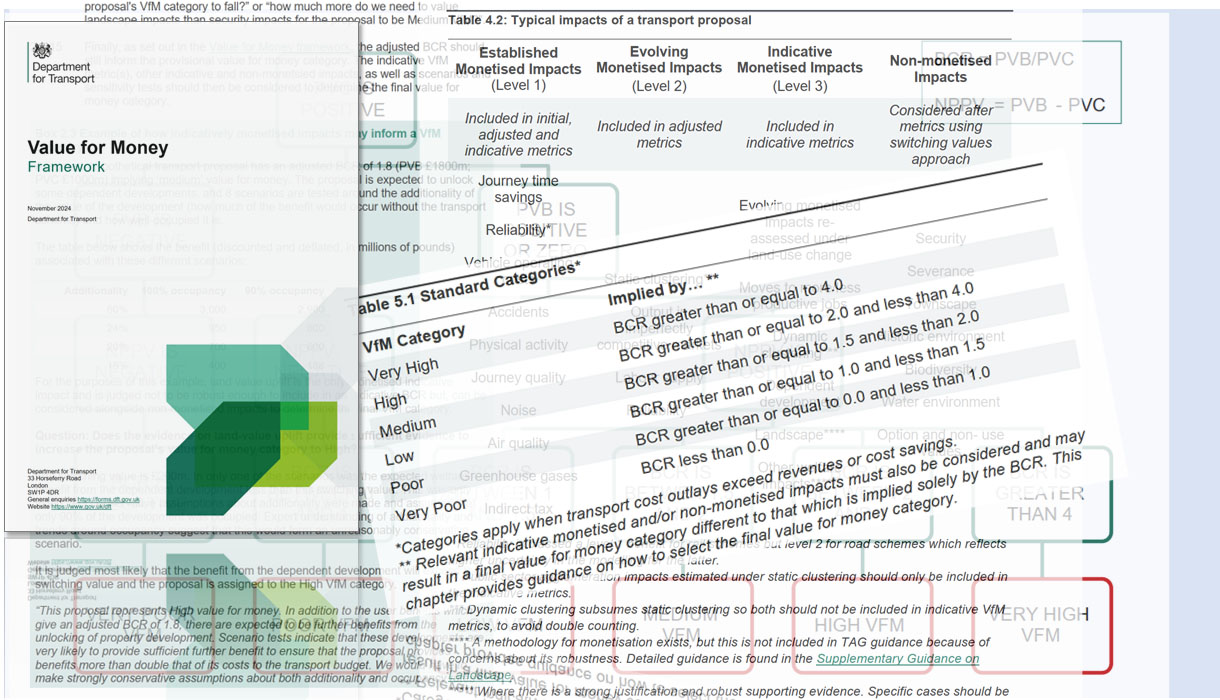
IMIs are mainly[2] WEIs that go beyond the basic TAG methods, and beyond the benefits of improved transport connectivity, into the world of land-use change. A common example is dependent development, where a transport scheme unlocks development that would not otherwise happen. Another is if companies move location in response to major changes in the transport system. These are known as ‘Level 3 WEIs’. Although only the biggest schemes would have significant relocation effects, dependent development is a common impact for many local road schemes – indeed it’s often a major driver. If these impacts exist for your project, you can just describe them in words – as non-monetised impacts – but if significant enough you will often try to put a £ value on them, to make them IMIs.
The problem with IMIs is that their methods are less robust than for the other impacts: perhaps less well-established, weaker evidence bases, big assumptions involved, black-box tools or any of the above. So until now, the Framework has not included them in the BCRs[3].
Instead, the IMIs fed into the final VfM category, along with the non-monetised impacts and the other factors I mentioned before. To cut a long story short, you decide whether these factors mean the final category should be different from the provisional one. For the IMIs, this includes doing switching analysis, which is best explained with an example:
If your adjusted BCR is 1.8 (medium VfM), how much extra benefit would you need from dependent development (DD) to bump your scheme up to 2.0 and high VfM? Then look back at the DD figures. If you’ve run several DD scenarios that mostly give benefits well above that figure, you can probably justify calling it high VfM. But if your scenarios are a mix of above and below that figure, it’s harder to justify and you might have to stick with medium VfM.
The final step is to produce a VfM Statement which sums it all up for the decision-makers: key facts and uncertainties about the impacts; the VfM category and how it was decided; how confident you can be in it; and the distributional impacts. You also need to look at the impact on objectives, of which more later.
The new
The new approach retains the existing Initial and Adjusted BCRs, but creates an extra one: the Indicative BCR. It includes the ‘indicative monetised impacts’ (IMIs), primarily the monetised Level 3 WEIs, that are not allowed to go in the initial or adjusted BCR.
It’s a new intermediate step in the process: take the calculations for the Adjusted BCR, add the indicative monetised impacts, and you get the Indicative BCR which will normally be higher than the adjusted one.

There are two catches. First, you’re not supposed to update the VfM category at this extra stage (but I bet people will anyway).
Second, and more important, you can’t just include any old numbers in this indicative BCR. The guidance requires “a strong justification for their robustness and relevance”, and gives a checklist to follow:
- Justify them based on economic theory, and make sure the welfare impacts are clear
- Follow the relevant Green Book guidance
- If Supplementary Economic Modelling (SEM) is used, meet the robustness criteria set out in TAG
- Have an independent peer review of the modelling approach, and take the feedback on board
- Set out the key parameters, the evidence base for them, and the results of sensitivity tests (eg as a BCR range). Where relevant, look at uncertainty in inputs, eg by using the Common Analytical Scenarios (CAS).
IMIs that meet these criteria can go in the new Indicative BCR. It then becomes an extra factor, alongside the existing ones, in the judgment you make about the final VfM Category. Any IMIs that don’t make it into the Indicative BCR can still be considered in the same way as before, via switching analysis.
What difference does it make?
At first glance, this is an important change. Schemes with level 3 WEIs (or other IMIs) can now include these in the BCR in a way that they couldn’t before. The existing approach has been criticized for not giving enough weight to these types of benefits, with BCRs not reflecting well enough the full range of a scheme’s benefits.
It potentially affects a lot of major schemes: not just the largest (HS2-scale or East-West-Expressway-scale) schemes that are expected to shape land-use patterns, but also locally-promoted schemes that aim to unlock specific development sites.
Certainly it is true that the BCRs have until now not reflected these impacts. But that’s not the whole story, and until the dust settles I’m cautious about the real scale of the change.
The existing rules already allowed these impacts to be considered: not within the BCR, but in coming to the final VfM category and in the VfM statement – and (in reality) in the decision-maker’s background understanding and other briefing material. So on the letter of the rules, it’s a change in the process but not in the final reckoning.
But it may still be a significant change in other, perhaps more psychological, ways.
- If the lack of a level 3 BCR has in practice been unfairly diminishing the weight given to these impacts – in other words, if the level 3 impacts are being forgotten at the final judgment stage – then it makes sense to correct this problem.
- If the Indicative BCR encourages promoters to monetise significant level 3 impacts that they would not previously have bothered with before ‘because it doesn’t help the BCR’, then this too is a positive.
- If the Indicative BCR – with the checklist as gatekeeper – encourages serious, well-evidenced level 3 analyses and discourages less-rigorous ones with heroic assumptions and ‘top-end’ numbers, then that’s very welcome. But the quality of the gatekeeping will matter.
- And finally, however much transport appraisal professionals try to emphasise that it’s about more than just the BCR, in reality BCRs provide important headlines and soundbites that shape the perception of schemes. So we might as well bring the full range of monetised impacts into the BCR fold.
The BCR thresholds: when is a rounding error a real error?
Onto the other changes. First, some ambiguities in the VfM category thresholds have been removed. Previously BCRs at 1, 1.5 and 2 were ambiguous as to whether they went into the category above or below that number. They now explicitly go into the category above: for example, 1.5 goes upwards to ‘medium’, not downwards to ‘low’. This matches what scheme promoters would do anyway.
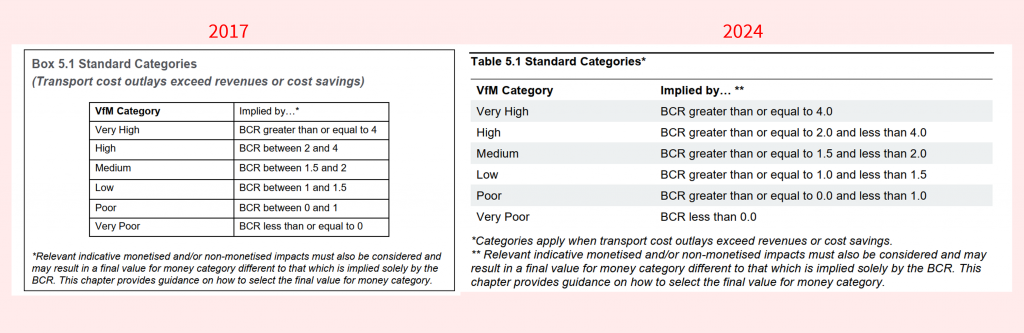
There is still some wiggle room, however. A calculated BCR of, say, 1.47 will usually be rounded to 1.5 for reporting. This is fine in itself: one decimal place is a fair level of precision, given the approximations and estimations involved. But the 1.5 then gets treated as ‘medium’ although this isn’t what the original number was. Some guidance on this situation might be helpful. But for me, this illustrates how you should not get too hung up on the exact BCR number when in reality you are on the cusp of two categories.
Journey time reliability
I mentioned that the value of journey time reliability (JTR) is one of the Level 2 impacts that can go into the Adjusted BCR. However, in a change not previously announced, JTR in rail schemes has been promoted to Level 1 (Established Monetised Impacts), meaning that it can go in the Initial BCR as well as the Adjusted BCR. I don’t see this as making much difference in practice.
Bringing-in the spending objective analysis
Last year, new TAG supplementary guidance introduced the concept of spending objective analysis, which looks at how well a proposal actually meets its objectives. It was prompted by the 2020 Green Book review which found that economic analyses weren’t always joined up with the strategic case and its objectives: a proposal might perform well economically but not actually meet the objectives.
TAG’s spending objective analysis complements the traditional economic aspects, drawing on the same appraisal results but to highlight whether the objectives are being met. The analysis should be reported as a narrative summary in the Spending Objective Analysis Statement (SOAS) which would sit alongside the VfM statement.
The new VfM framework catches-up with this, reminding us that “decision-makers should consider spending objective impacts, alongside value for money, when assessing the overall business case for a scheme” It also helpfully explains: “the VfM statement summarises evidence on social welfare impacts from a VfM perspective. Equivalently, the [SOAS] summarises this evidence from a spending objective impacts viewpoint.” It’s clear that the SOAS is not to be seen as merely subsidiary to the VfM statement.
Whose line is it anyway?
I mentioned at the start that local authorities, other stakeholders and technical consultants generally follow the framework’s key points, particularly the BCR types and VfM categories, even for schemes that are not going through DfT scrutiny. The previous version positively recommended local government to do so, and before that, there was specific guidance to local authorities that used the same basic process[4].
The new version no longer has that recommendation. I don’t yet know whether that’s a substantive change in expectations, or simply a tidying-up of the document. I’ll update this post if I find out more. (Update 12 December 2024: DfT have kindly confirmed that it is simply a tidying-up.)
Other changes
Finally, a quick round-up of some of the remaining changes:
- Other updates to the text that reflect current TAG, including the role of place-based analysis (another response to the Green Book review) and the common analytical scenarios.
- New advice on inferring a BCR range from a VfM category – and the pitfalls in doing so.
- The previous text and diagrams about logic mapping and the ‘3 Es’ of economy, efficiency and effectiveness have been removed. This is understandable. Logic mapping is covered elsewhere, and the 3Es, although a very valuable concept, didn’t really flow into the VfM framework’s approach.
And that’s what’s new in the DfT Value for Money Framework for 2024.
As always, comments are welcome below, and if you found this post useful, please tell others about it.
[1] However, an earlier document, titled ‘Value for Money Assessments’ and dating from 2015 or earlier, does refer to identifying the initial VfM category based on the initial BCR.
[2] Monetised landscape impacts also count as IMIs. From November 2024 TAG also allows static agglomeration for public sector jobs to be counted under WEIs; static agglomeration in other sectors counts as Level 2 and as part of the Adjusted BCR, but in the public sector it’s a Level 3 IMI.
[3] Before 2017, IMIs could be used for a ‘sensitivity test BCR’, which did what it says on the tin. This wording was not part of the 2017 guidance, which instead focused on switching value analysis. In practice, it’s difficult to avoid thinking “if we included them, the BCR would be…”, which amounts to a similar thing.
[4] Value for Money Assessment: Advice Note for Local Transport Decision Makers (2013)
Contains public sector information licensed under the Open Government Licence v3.0.