 by
by Why has travel still not returned to pre-Covid levels? Twenty-first century trends in trip levels by journey purpose might offer a clue.
The National Travel Survey (NTS), conducted annually by the Department for Transport, is a rich dataset on individual travel patterns and their trends in England. The 2024 results were recently released and have been covered extensively in Local Transport Today.
Since the end of the Covid-19 pandemic, there has been debate on how far – and how quickly – travel demand will recover to pre-Covid levels. By 2023, we had moved out of the rapid bounceback phase and into a more stable ‘new normal’, albeit accepting that travel patterns may continue to change. Hence, for example, the 2022 National Road Traffic Projections assumed a permanent residual Covid ‘shock’ to car vehicle miles, within a range of uncertainty over this. And rail commuting has taken an ongoing hit but there are debates over whether the particularly-diminished Monday and Friday commuting levels are bouncing back towards the current midweek levels.
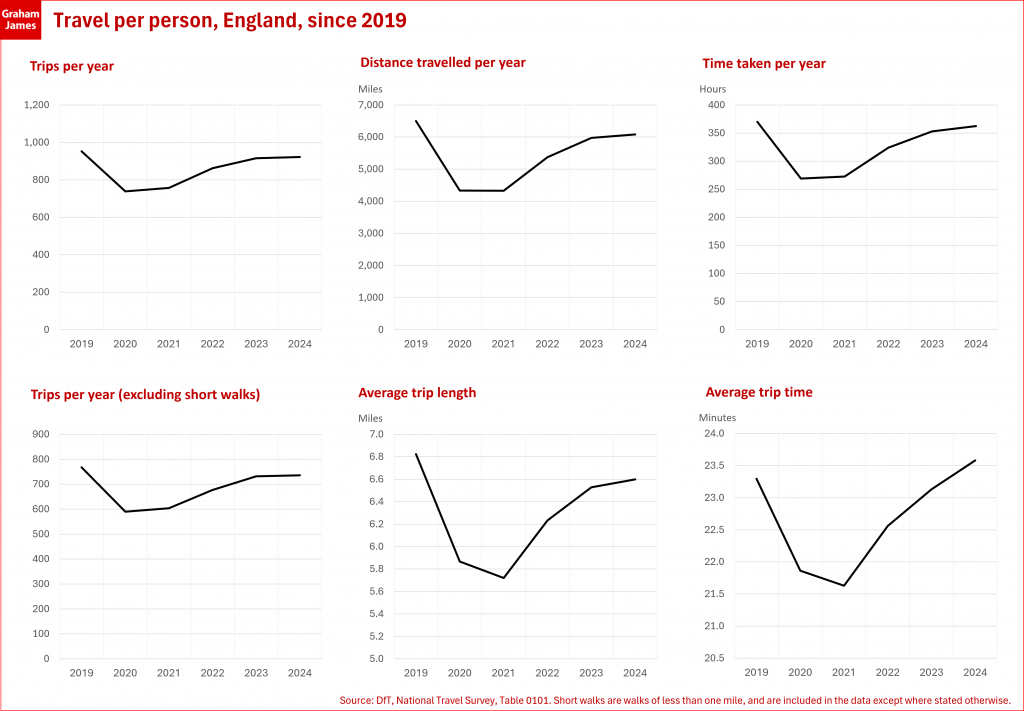
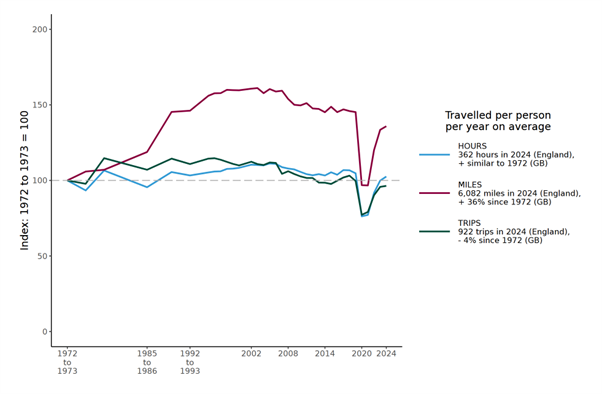
For many types of travel, this ‘new normal’ is still below pre-Covid levels (for which 2019 is generally taken as the benchmark). And this is also true for the overall amount of travel per person, revealed in the NTS results:
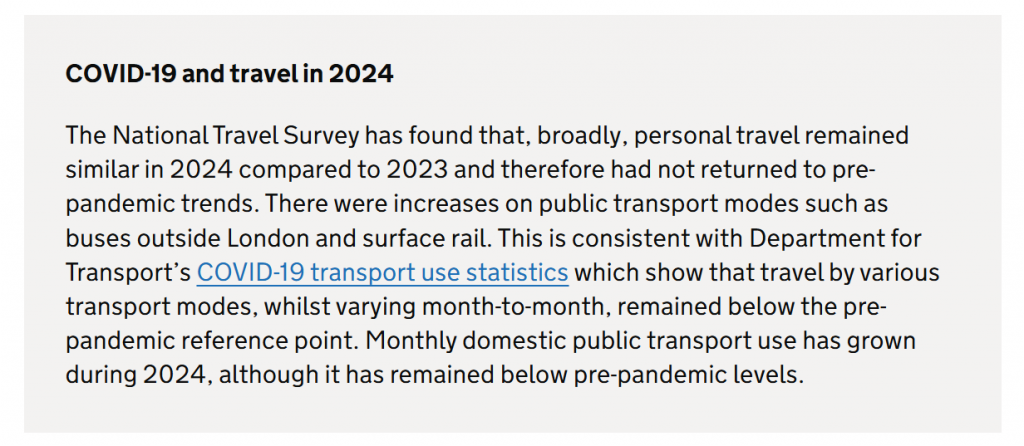
DfT’s commentary put it like this:
At first glance, this indicates either an ongoing, permanent reduction in per-person travel, or that full recovery is not yet complete. The debate will continue. But there’s a twist.
Since the early 2000s, there has been a gradual decline in overall trip rates and distances travelled per person. This particularly reverses the previous trend of increasing distances. Travel time has been more stable by comparison but has still declined a little. This big picture has been covered extensively by David Metz whose work in this area is essential reading.
In the absence of Covid, and all else being equal, we might have expected the decline in trips and distances to continue. And indeed these two measures are back up to around the (reduced) level we would have seen if the recent trend had continued.
That’s not to say for sure, of course, that the trend is indeed continuing. Trends don’t last for ever, and Covid may have been a ‘reset’ point as well as a shock in its own right. Equally there are sometimes suggestions that Covid may have accelerated pre-existing trends, most obviously the adoption of teleconferencing or making transactions online. It’s hard to disentangle.
Luckily there are some clues in the NTS data, which from 2002 are broken down into 15 journey purposes. DfT has helpfully graphed most of them:
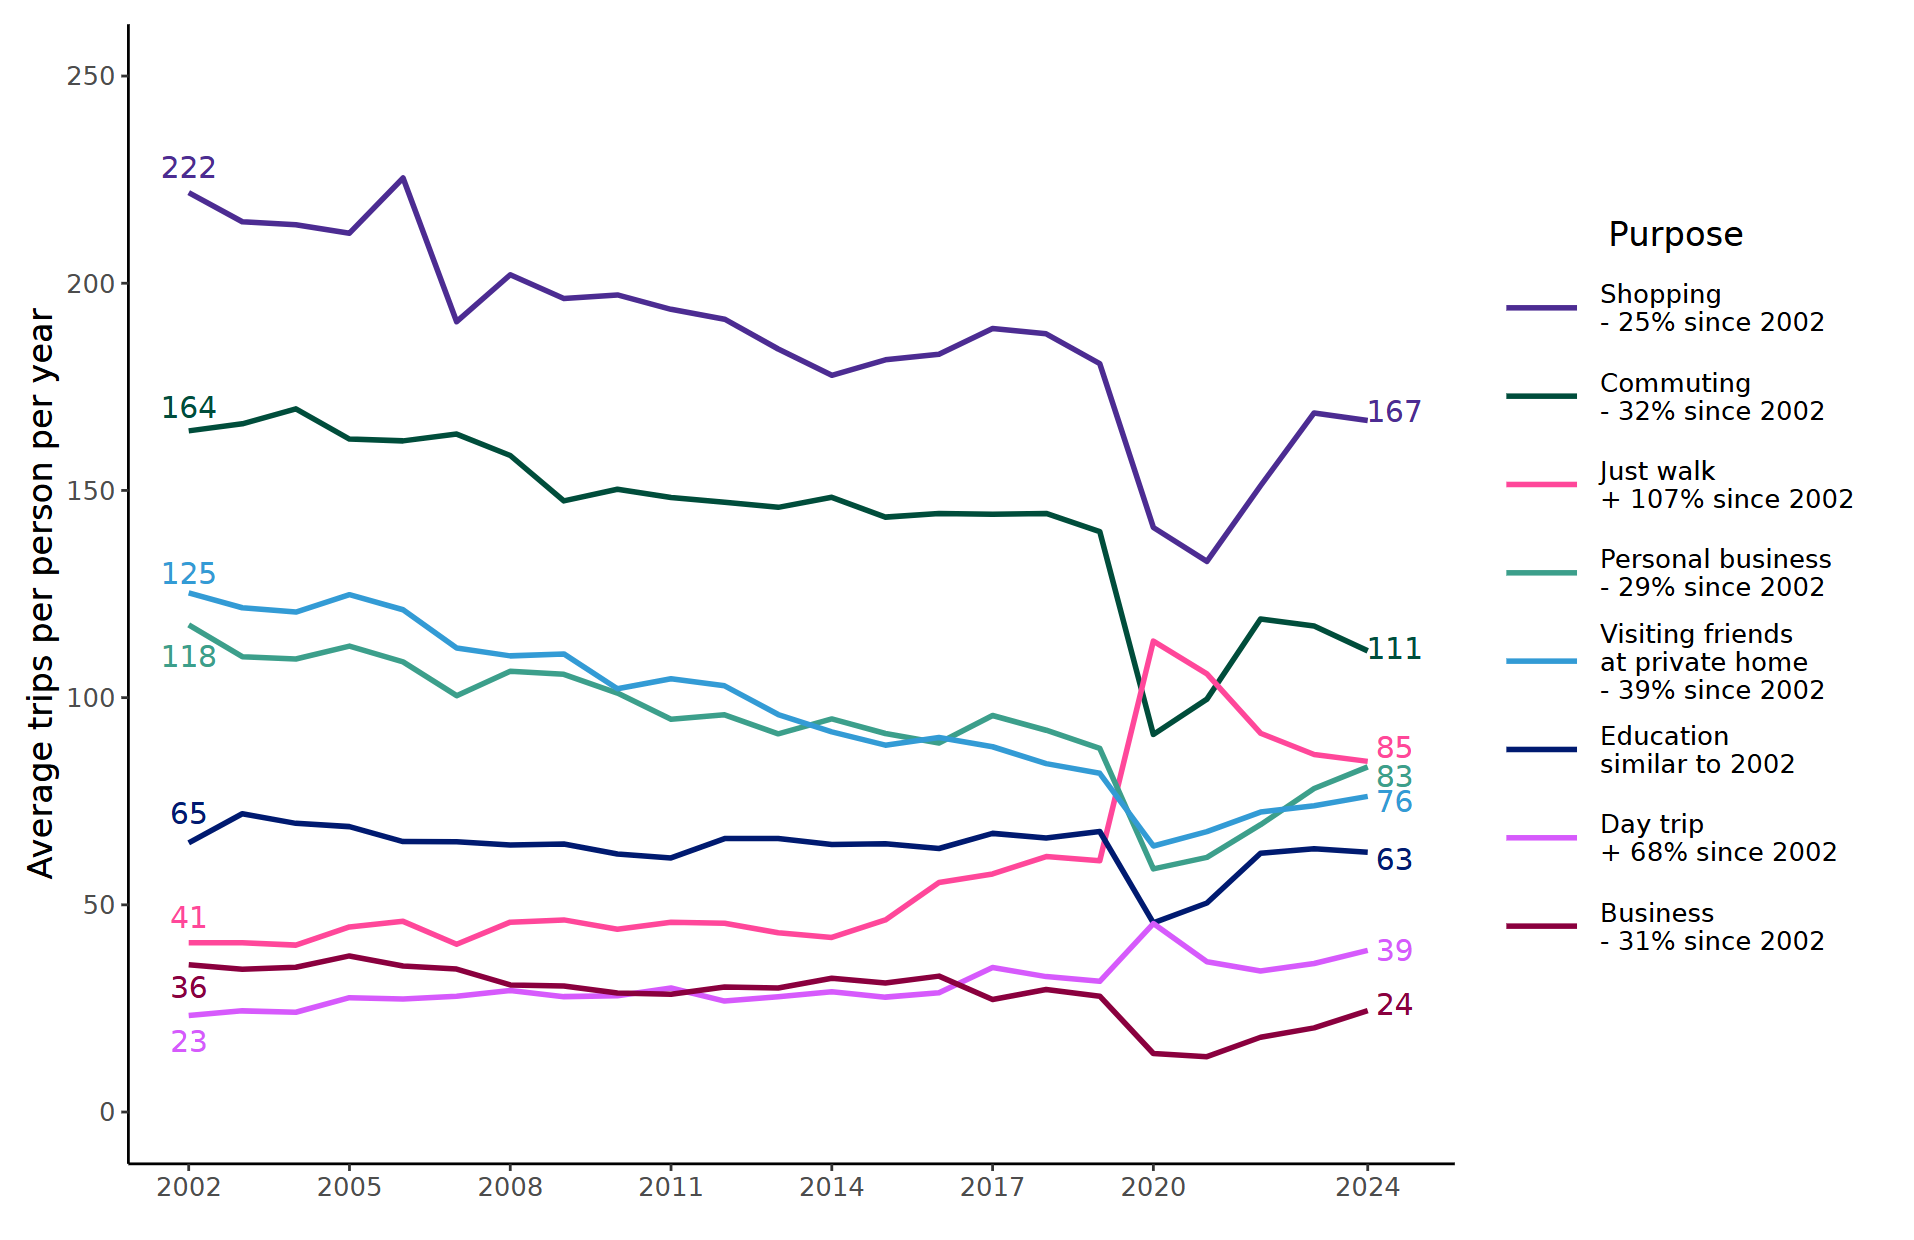
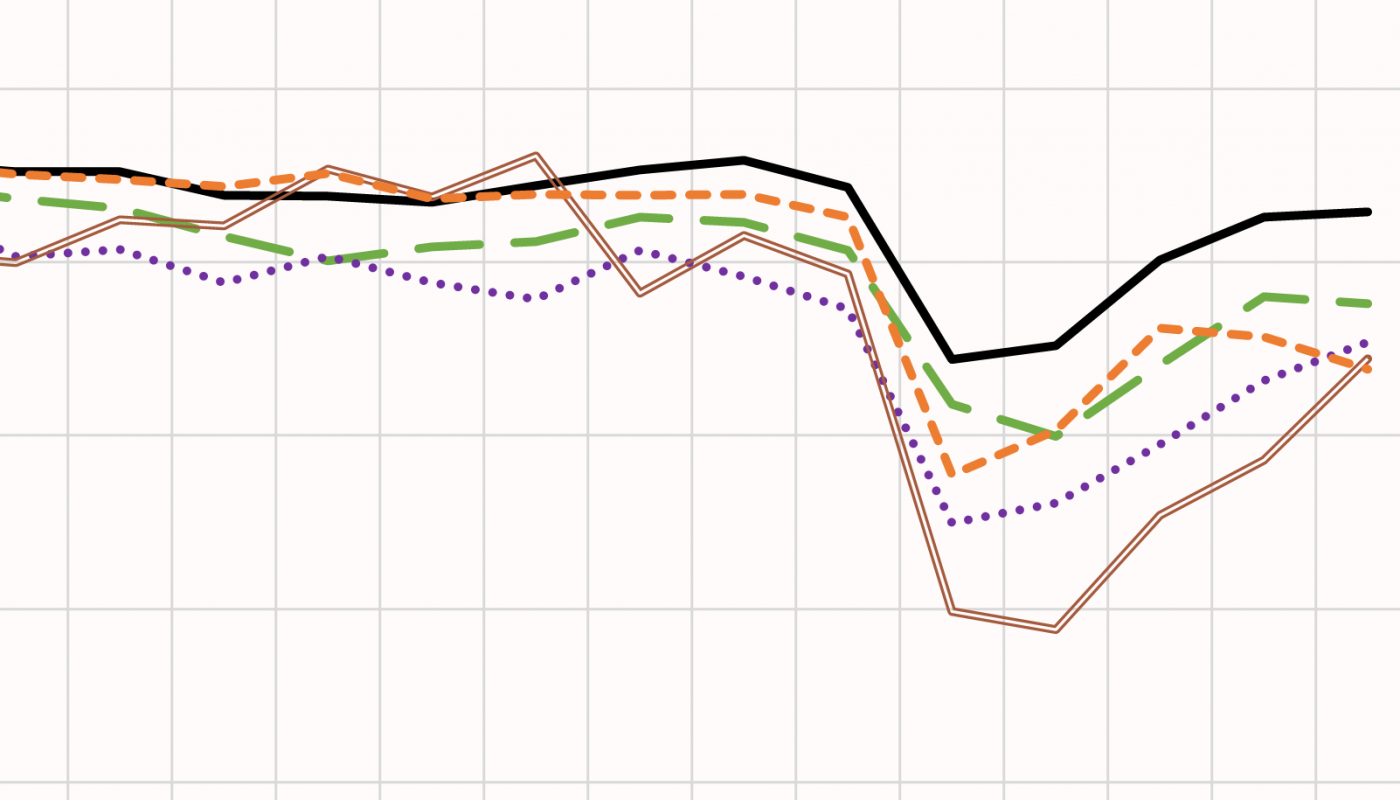
I’ll just mention a few of particular interest. The chart below shows (on an index basis) the trip-rate trends for commuting, business, shopping and personal business, as well as the overall trend. The pattern for distance travelled is similar, although not identical.
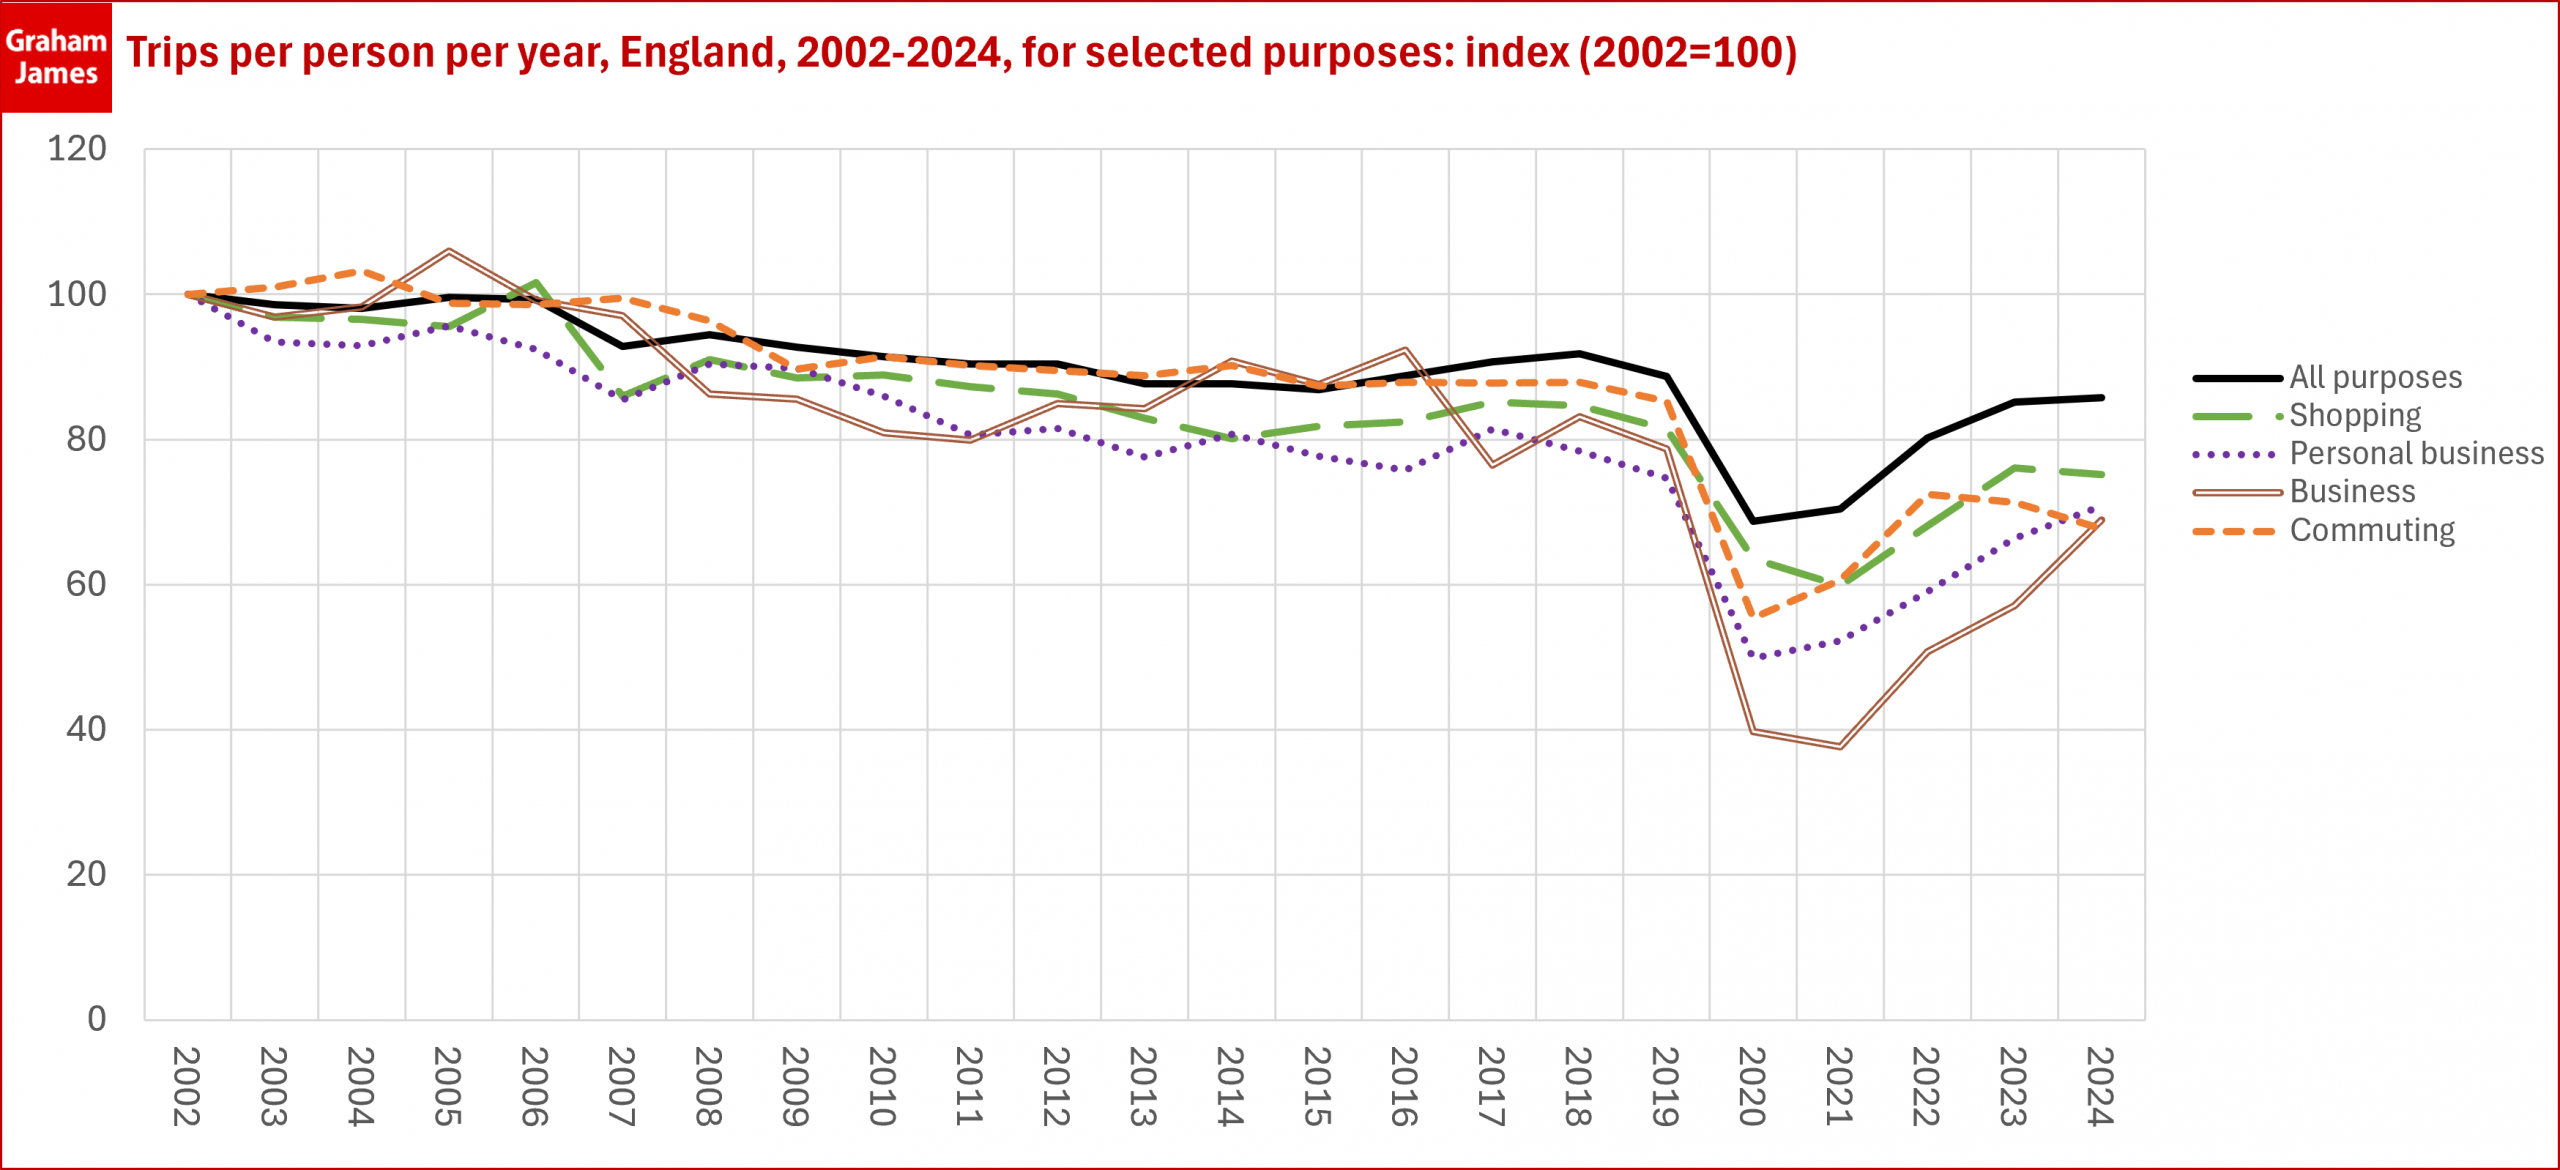
Trip rates for shopping and personal business were declining pre-Covid (more than the average, so helping to bring the average down), perhaps reflecting the gradual growth of online shopping, banking and administrative services. If you extend those trendlines through the Covid era to 2024, both of these categories are now back on-trend.
Business travel has a similar picture, but less clear-cut. No doubt the relationship with the economic cycle complicates things. It’s worth remembering that this category includes a wide range of trips in the course of work, not just the white-collar ‘business meeting’ market that adopted videoconferencing by default during Covid. Hence, for example, the well-reported reduction in business travel by rail won’t show up particularly strongly in this chart.
Commuting is different. Pre-Covid it was declining at around the same rate as the all-purposes average. Drawing the trendline forward, we see commuting well below not just pre-Covid levels but also the expected level if the trend had continued. Indeed the post-Covid commuting bounceback has stalled, with mileage broadly steady and trip rates falling for 2022 to 2024.
What does this all mean? The figures do fluctuate from year to year, so I don’t want to read too much into the limited data so far in the ‘new normal’ period. They do seem to confirm that commuting has taken a long-term reduction – perhaps in this area Covid did indeed accelerate an existing trend. And for the other purposes I’ve covered, although they are below pre-Covid levels they are at levels consistent with the 21st century downward trend, as if Covid was a ‘blip’ that has now worked itself through. This, of course, is not proof that the trend is indeed continuing. Views welcome.
Some other trip purposes have interesting trends too:
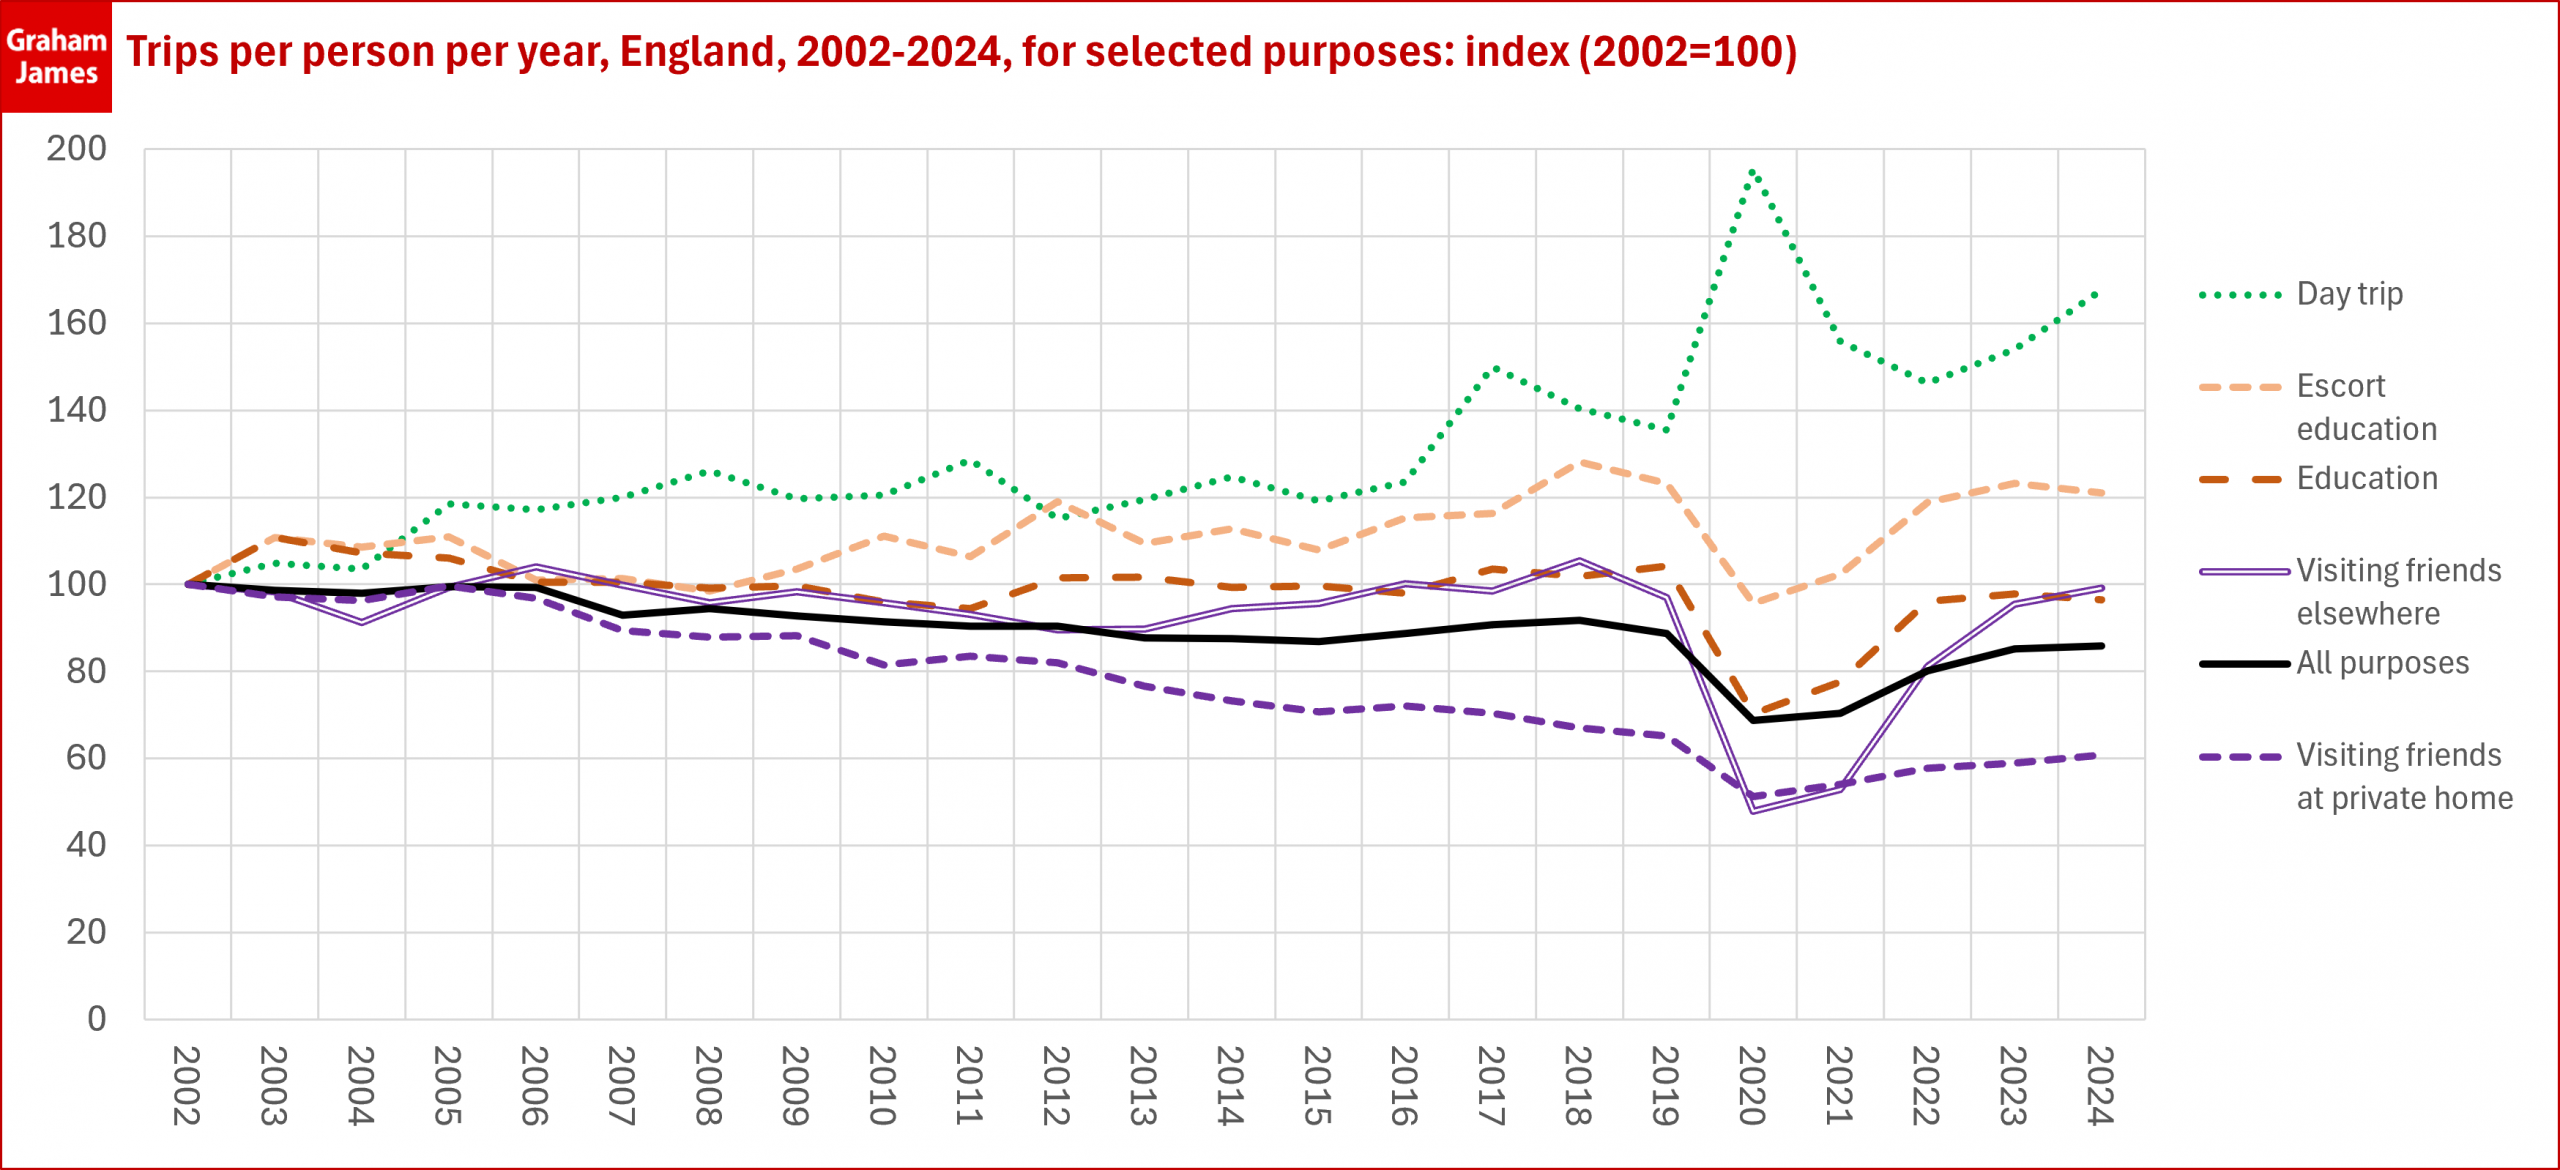
Day trips had been increasing before Covid, spiked during the pandemic, and are continuing to increase. Visiting friends at their home had been declining steeply pre-Covid – even before the advent of Facetime etc and all-you-can-eat data packages. Has the decline now bottomed-out? Visiting friends elsewhere has been steadier by comparison.
I’ve also taken the chance to add education trips and education-escort (eg accompanying children to school) trips to the chart. These are, of course, a big aspect of peak-time travel demand. More of the travel-to-school results are featured in DfT’s detailed commentary and in LTT.
Finally, some factors to remember:
- These are national-level figures for England. Your mileage might vary in your area and on your mode of travel.
- The 2020, 2021 and 2022 data are to be used with caution, as they were affected by data collection issues as well as Covid-related travel behaviour changes (which themselves varied over the course of each year).
- These figures are per person. Population growth will be drawing total trip volumes and total mileage back upwards.
As always, views and comments are welcome.