 by
by Graham explains the key points in the latest round of TAG updates. It’s a game of two halves, with a nice surprise in the second half.
June 2024 update: Since this post was written, all the updated units and other material have been published on the TAG website and have gone live. I have updated links where required, but have not updated the text.
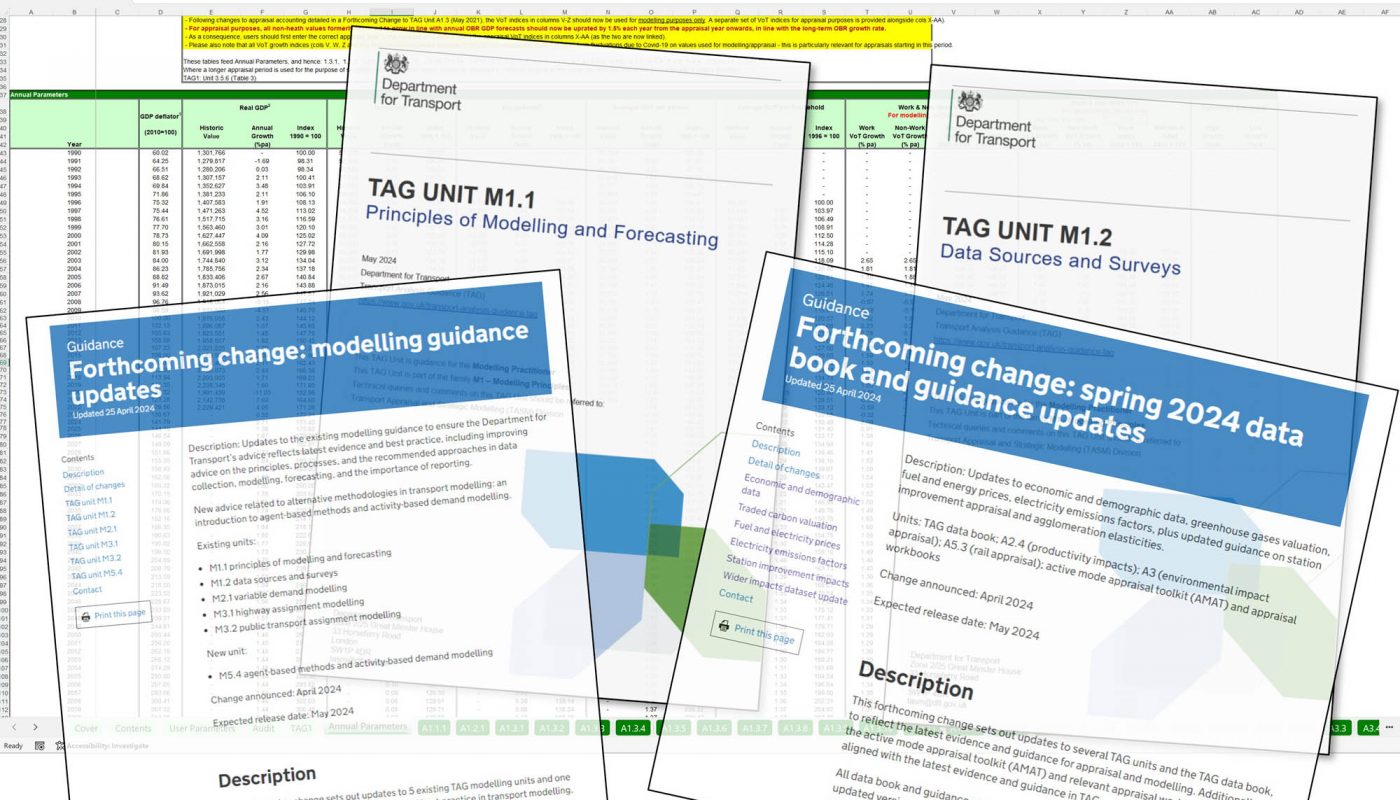
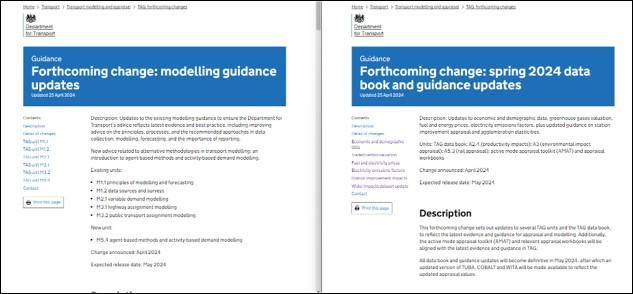
In late April, the DfT published the latest round of updates to its Transport Analysis Guidance (TAG). We’ve known for a while that they have been working on a round of updates to the modelling guidance, and attendees at last autumn’s TAGFest had a preview of the main points. The updated modelling units have now been published, with an accompanying forthcoming change (FC) notice.
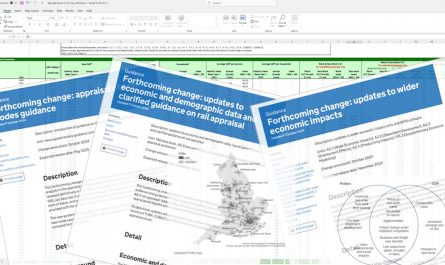
The other half of the latest changes, with a separate FC notice, is mostly routine updates to the economic, demographic and other data in the Databook which feed into a lot of the calculations and various workbooks. But there are a couple of extra items, including a handy surprise. The updated Databook, workbooks and relevant units are not yet available, but the FC notice gives the gist of the changes, plus some of the updated data. Much of the other data comes originally from ONS, OBR or DESNZ datasets, and there are links to these if you’re keen to look at them before they come through to the Databook.
As usual, I’ve updated my Tag-at-a-Glance page to give a unit-by-unit summary of these changes. This post just covers the highlights and some of the background to them.
Modelling guidance updates
I’ll leave it to the modelling specialists to give you a full run-down on the updated technical detail in the modelling units. But although there are a lot of updates and additions, I don’t sense many real changes to how we do things. It’s more about updating the guidance to reflect current practice, latest developments and things that were always dealt with in practice but weren’t necessarily covered in the guidance.
Unit M1.1 (Principles of modelling and forecasting) has had a general refresh and some areas have been expanded. Although it’s a modelling-focused unit, the advice here is useful to anyone who works alongside modellers – even if you’re not directly involved in modelling yourself – so I’d encourage all transport planners to read it. There are useful reminders, such as about how it’s rare for a typical highway assignment model to include active-mode route choice (4.5.10). A handy new section de-confuses ‘agent based’ and ‘activity based’ models (a pitfall as both are shortened to ‘ABM’) and gives a brief introduction to the activity-based ones (4.7.11-16). There’s discussion of new forms of activity (eg MAAS and CAVs) and how they relate to modelling (4.8.5-4.8.7), plus some of the basics of modelling active travel (4.8.1-4.8.4) and quality assurance of forecasts (5.3.1-5.3.5). Finally, a major new section covers the essentials of reporting requirements at each stage from model specification to forecasting (section 6).
Unit M1.2 (Data sources and surveys) has also been refreshed and updated. The top headline item previously advertised is a new section on mobile network data: what we colloquially think of as mobile phone data but also includes other GPS data such as from fleet tracking devices. However, the additions also cover a wide range of other data sources beyond the traditional traffic data and public transport user surveys: Mosaic, Acorn, the Index of Multiple Deprivation (IMD), the Bus Open Data Service (BODS) and many others. The immensely valuable Realtime Trains gets a deserved mention (other rail data providers are available). Again, this unit will be useful to any transport planner looking to understand what data are out there, even if not to feed into a model.
At the more technical level, unit M2.1 (Variable demand modelling) has substantive updates to some model parameters. This is definitely one for modellers:
- The illustrative parameters for destination choice (was Table 5.1, now Table 3) are unchanged but there is new advice on using these in cost-damped models.
- The illustrative main mode choice theta scaling parameters (don’t ask…) have been updated (was Table 5.2, now Table 4).
- The advice on elasticities and the corresponding parameters (section 6.4 and Appendix A) have been updated and expanded.
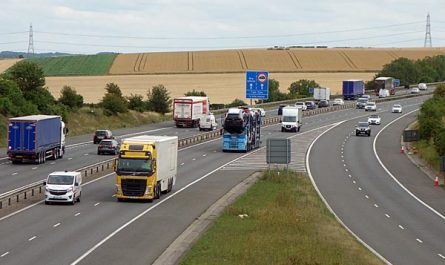
M2.2 (Base year model development) is unchanged, so the next updates are in M3.1 (Highway assignment modelling). The key change here is the new guidance on microsimulation modelling (new Appendix C). This is really about applying the TAG guidance to microsim, rather than being a ‘how-to’ guide, but nevertheless runs to a meaty 16 pages. Elsewhere in the unit there are other new references to microsim as well as minor general clarifications and updates.
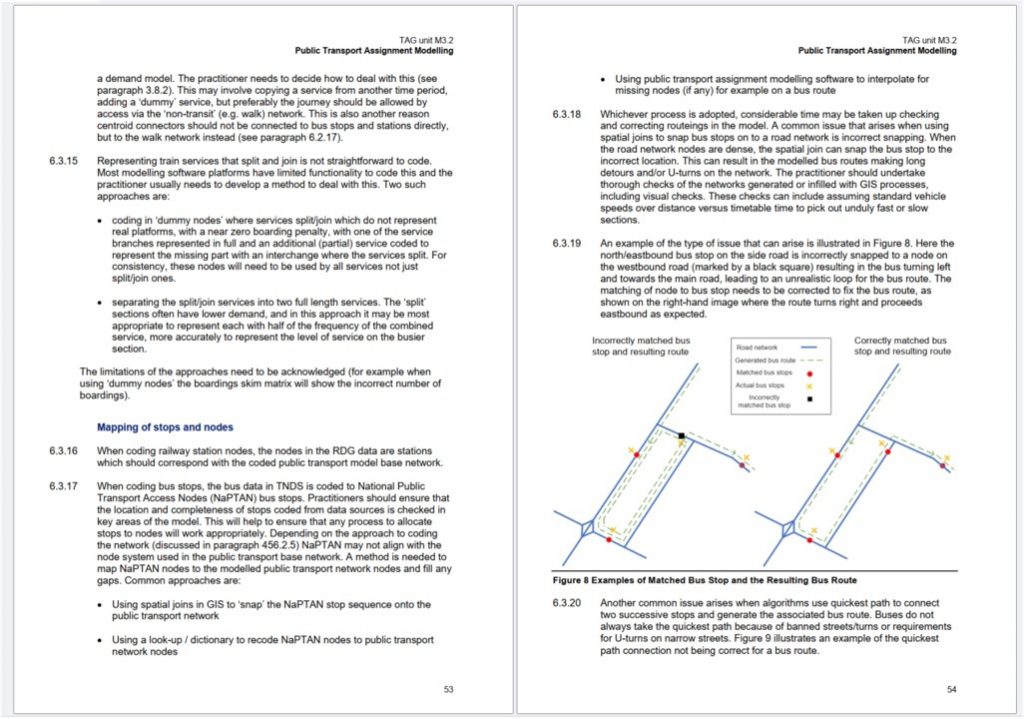
Unit M3.2 (public transport assignment modelling) has been restructured and considerably expanded in a number of areas: in fact, 21 pages have become 85. The new material will need some time to digest properly, but already the expanded validation criteria have caught my eye, along with the considerably enhanced guidance on crowding. The new advice on practicalities such dealing with as trains which join/split, and on mapping of bus stops to routes, does look like it covers some of the common practical issues that tend to come up.
Finally, all-new unit M5.4 covers agent-based models and activity-based demand modelling. The unit explains what these are, where they could be useful, and the principles of validating them. But it’s not detailed guidance on developing these types of model. Indeed it’s not even seen as guidance on using them in transport appraisal – or approval to do so. But the intent is for this unit to evolve over time as these methods become more familiar.
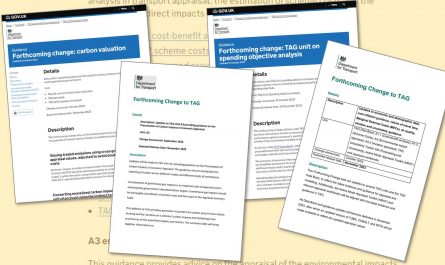
Emissions prices for traded carbon
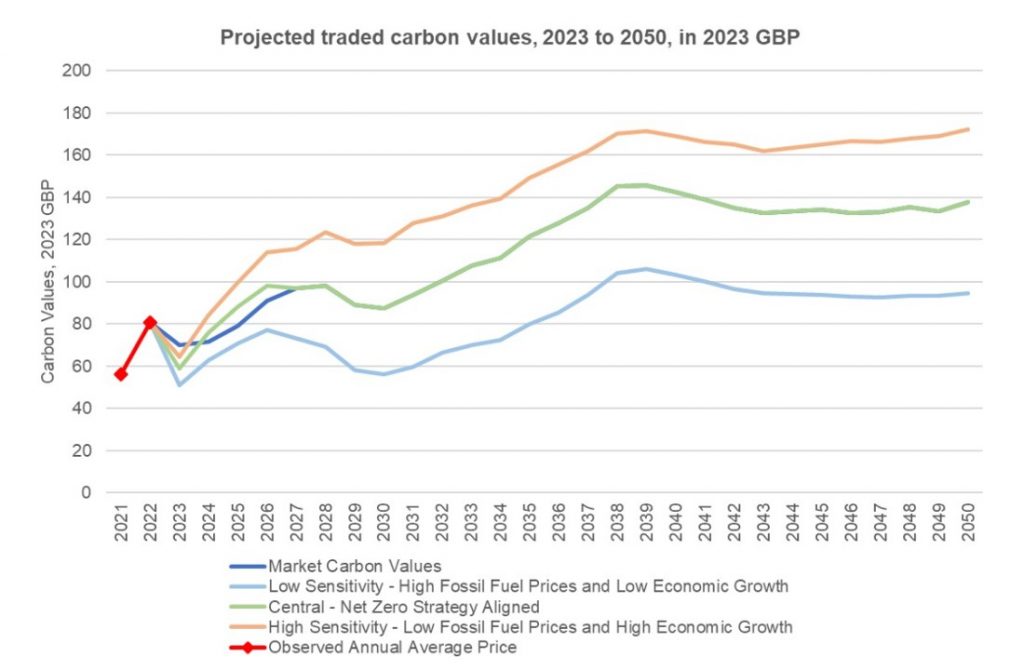
Onto the other half of the game, and I’ll start with the nice surprise. Following last year’s changes to the guidance on carbon valuation, we now need to include the traded carbon impacts (essentially the embodied carbon), net of the prices paid under the UK and EU Emissions Trading Schemes (ETS) (blog passim). As I’ve mentioned before, we therefore need to get familiar with using carbon-price forecasts. There are various published sources for these. I, and others, felt that guidance on a ‘standard’ one to use could be useful to preserve comparability between appraisals as well as to keep life simple, but this wasn’t expected to happen particularly soon.
Last November, the Department for Energy Security and Net Zero (DESNZ – say it ‘Dez-Nez’) handily published its own set of carbon-price projections, and the forthcoming change notice says TAG will now recommend our assumptions are ‘informed by’ these. This looks like a nice surprise as it has the potential to standardise and simplify an area that we all need to get to grips with. Once the updated TAG unit A3 is out, I’ll look at the detail and hopefully do a specific blogpost on this. In the meantime, if you look at the DESNZ figures, note that they are in 2023 prices rather than our familiar 2010 prices.
Databook updates
The first change in the May 2024 databook (version 1.23) is the routine update to the economic and demographic data. The changes reflect updated outturn data (what’s actually happened in the past) from the ONS, plus medium-term forecasts up to 2028 or 2028/29 from the latest OBR Economic and Fiscal Outlook. Data beyond that point are not being updated this time round. The Active Mode Appraisal Toolkit (AMAT) and the environmental workbooks that use this data will be updated accordingly, along with TUBA, COBALT and WITA.
Other databook changes reflect the latest DESNZ fuel and electricity price forecasts. Noticeable here is the significant reduction in forecast petrol and diesel prices, which from 2035 are over 30% lower than in the current databook. The Forthcoming Change notice traces this back to a change in the International Energy Agency’s long-term oil price forecast, which in turn reflects higher-than-previous forecasts of electric vehicle uptake.
The latest DESNZ electricity emissions factors – the estimated carbon emissions per unit of electricity consumed – are also being brought into the Databook. There are large changes here too, with both road and rail emission rates in the late-2030s and the 2040s (an important period for many appraisals) being less than half of the previous forecasts.
Finally, the carbon price values described above will be added to the databook.
Other changes
The wider impacts dataset, used for agglomeration calculations, will be updated with ONS outturn data and OBR medium-term forecasts to 2028, in a similar way to the Databook.
Finally to the rail world. Unit A5.3’s advice on the impacts of station improvements is being updated with further evidence on valuations for these improvements. (As a side note, it’s always worth remembering that TAG and the rail industry’s Passenger Demand Forecasting Handbook don’t always use the same parameters.) And in a methodological change, business trips will no longer be excluded from these valuations, or indeed from demand uplifts due to station improvements.
Contains public sector information licensed under the Open Government Licence v3.0.